
大家好,又见面了,我是你们的朋友全栈君。
摘自https://docs.opencv.org/4.2.0/d7/d4d/tutorial_py_thresholding.html
Simple Thresholding
The function cv.threshold is used to apply the thresholding. The first argument is the source image, which should be a grayscale image. The second argument is the threshold value which is used to classify the pixel values. The third argument is the maximum value which is assigned to pixel values exceeding the threshold. OpenCV provides different types of thresholding which is given by the fourth parameter of the function.
The method returns two outputs. The first is the threshold that was used and the second output is the thresholded image.
import cv2 as cv
import numpy as np
from matplotlib import pyplot as plt

img = cv.imread('gradient.png',0)

ret,thresh1 = cv.threshold(img,127,255,cv.THRESH_BINARY)
ret,thresh2 = cv.threshold(img,127,255,cv.THRESH_BINARY_INV)
ret,thresh3 = cv.threshold(img,127,255,cv.THRESH_TRUNC)
ret,thresh4 = cv.threshold(img,127,255,cv.THRESH_TOZERO)
ret,thresh5 = cv.threshold(img,127,255,cv.THRESH_TOZERO_INV)

titles = ['Original Image','BINARY','BINARY_INV','TRUNC','TOZERO','TOZERO_INV']
images = [img, thresh1, thresh2, thresh3, thresh4, thresh5]

for i in xrange(6):
    plt.subplot(2,3,i+1),plt.imshow(images[i],'gray')
    plt.title(titles[i])
    plt.xticks([]),plt.yticks([])
plt.show()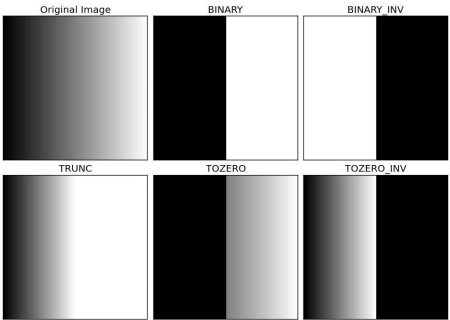

Adaptive Thresholding
In the previous section, we used one global value as a threshold. But this might not be good in all cases, e.g. if an image has different lighting conditions in different areas. In that case, adaptive thresholding can help. Here, the algorithm determines the threshold for a pixel based on a small region around it.
In addition to the parameters described above, the method cv.adaptiveThreshold takes three input parameters:
The adaptiveMethod decides how the threshold value is calculated:
- cv.ADAPTIVE_THRESH_MEAN_C: The threshold value is the mean of the neighbourhood area minus the constant C.
- cv.ADAPTIVE_THRESH_GAUSSIAN_C: The threshold value is a gaussian-weighted sum of the neighbourhood values minus the constant C.
The blockSize determines the size of the neighbourhood area and C is a constant that is subtracted from the mean or weighted sum of the neighbourhood pixels.
import cv2 as cv
import numpy as np
from matplotlib import pyplot as plt

img = cv.imread('sudoku.png',0)
img = cv.medianBlur(img,5)

ret,th1 = cv.threshold(img,127,255,cv.THRESH_BINARY)
th2 = cv.adaptiveThreshold(img,255,cv.ADAPTIVE_THRESH_MEAN_C,cv.THRESH_BINARY,11,2)
th3 = cv.adaptiveThreshold(img,255,cv.ADAPTIVE_THRESH_GAUSSIAN_C,cv.THRESH_BINARY,11,2)

titles = ['Original Image', 'Global Thresholding (v = 127)', 'Adaptive Mean Thresholding', 'Adaptive Gaussian Thresholding']
images = [img, th1, th2, th3]
for i in xrange(4):
    plt.subplot(2,2,i+1),plt.imshow(images[i],'gray')
    plt.title(titles[i])
    plt.xticks([]),plt.yticks([])
plt.show()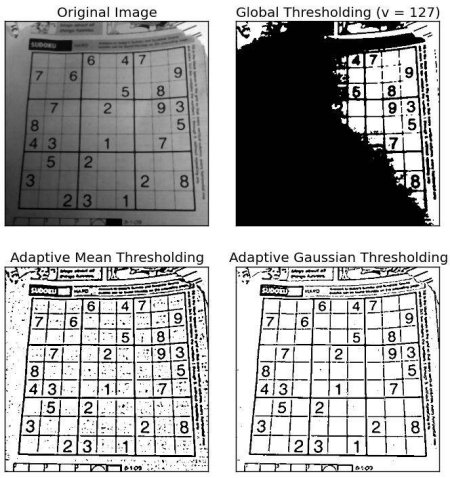
Otsu’s Binarization
Consider an image with only two distinct image values (bimodal image), where the histogram would only consist of two peaks. A good threshold would be in the middle of those two values. Similarly, Otsu’s method determines an optimal global threshold value from the image histogram.
In order to do so, the cv.threshold() function is used, where cv.THRESH_OTSU is passed as an extra flag. The threshold value can be chosen arbitrary. The algorithm then finds the optimal threshold value which is returned as the first output.
Check out the example below. The input image is a noisy image. In the first case, global thresholding with a value of 127 is applied. In the second case, Otsu’s thresholding is applied directly. In the third case, the image is first filtered with a 5×5 gaussian kernel to remove the noise, then Otsu thresholding is applied.
img = cv.imread('noisy2.png',0)

# global thresholding
ret1,th1 = cv.threshold(img,127,255,cv.THRESH_BINARY)

# Otsu's thresholding
ret2,th2 = cv.threshold(img,0,255,cv.THRESH_BINARY+cv.THRESH_OTSU)

# Otsu's thresholding after Gaussian filtering
blur = cv.GaussianBlur(img,(5,5),0)
ret3,th3 = cv.threshold(blur,0,255,cv.THRESH_BINARY+cv.THRESH_OTSU)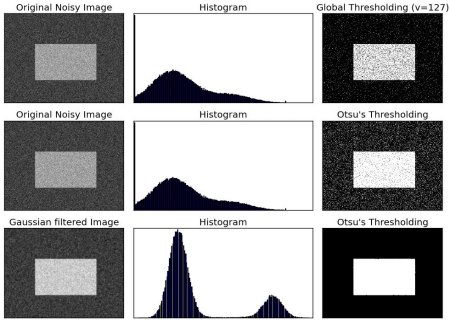
发布者:全栈程序员-站长,转载请注明出处:https://javaforall.net/132295.html原文链接:https://javaforall.net


