
大家好,又见面了,我是你们的朋友全栈君。
一、基础环境
| 环境/组件 | 版本 | 下载地址 |
|---|---|---|
| 操作系统 | CentOS 7.3 | http://archive.kernel.org/centos-vault/7.3.1611/isos/x86_64/CentOS-7-x86_64-DVD-1611.iso |
| Prometheus | 2.6.0 | https://prometheus.io/download/#prometheus |
| go | 1.11.4 | https://golang.org/dl/ |
| Grafana | 5.4.2 | https://dl.grafana.com/oss/release/grafana-5.4.2-1.x86_64.rpm |
二、安装go
1、解压安装
tar -C /usr/local/ -xvf go1.11.4.linux-amd64.tar.gz
2、配置环境变量
vim /etc/profile

export PATH=$PATH:/usr/local/go/bin

source /etc/profile
3、验证
go version


三、安装Prometheus
1、安装
tar -C /usr/local/ -xvf prometheus-2.6.0.linux-amd64.tar.gz
ln -sv /usr/local/prometheus-2.6.0.linux-amd64/ /usr/local/Prometheus
2、启动
普罗米修斯默认配置文件 vim /usr/local/Prometheus/prometheus.yml
/usr/local/Prometheus/prometheus --config.file=/usr/local/Prometheus/prometheus.yml &
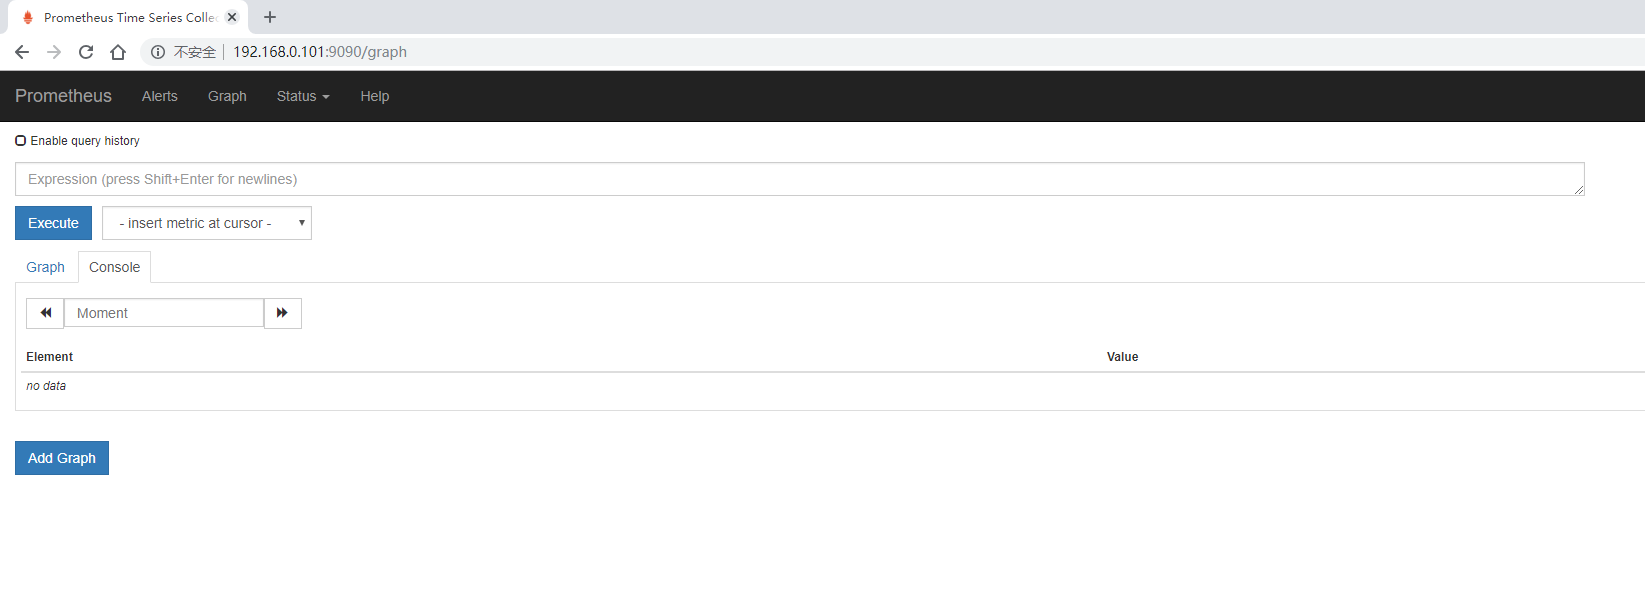
3、验证
浏览器打开IP:9090端口即可打开普罗米修斯自带的监控页面
四、安装Grafana
普罗米修斯默认的页面可能没有那么直观,我们可以安装grafana使监控看起来更直观
1、安装
rpm -ivh --nodeps grafana-5.4.2-1.x86_64.rpm
2、启动
sudo /bin/systemctl daemon-reload
sudo /bin/systemctl enable grafana-server.service
sudo /bin/systemctl start grafana-server.service
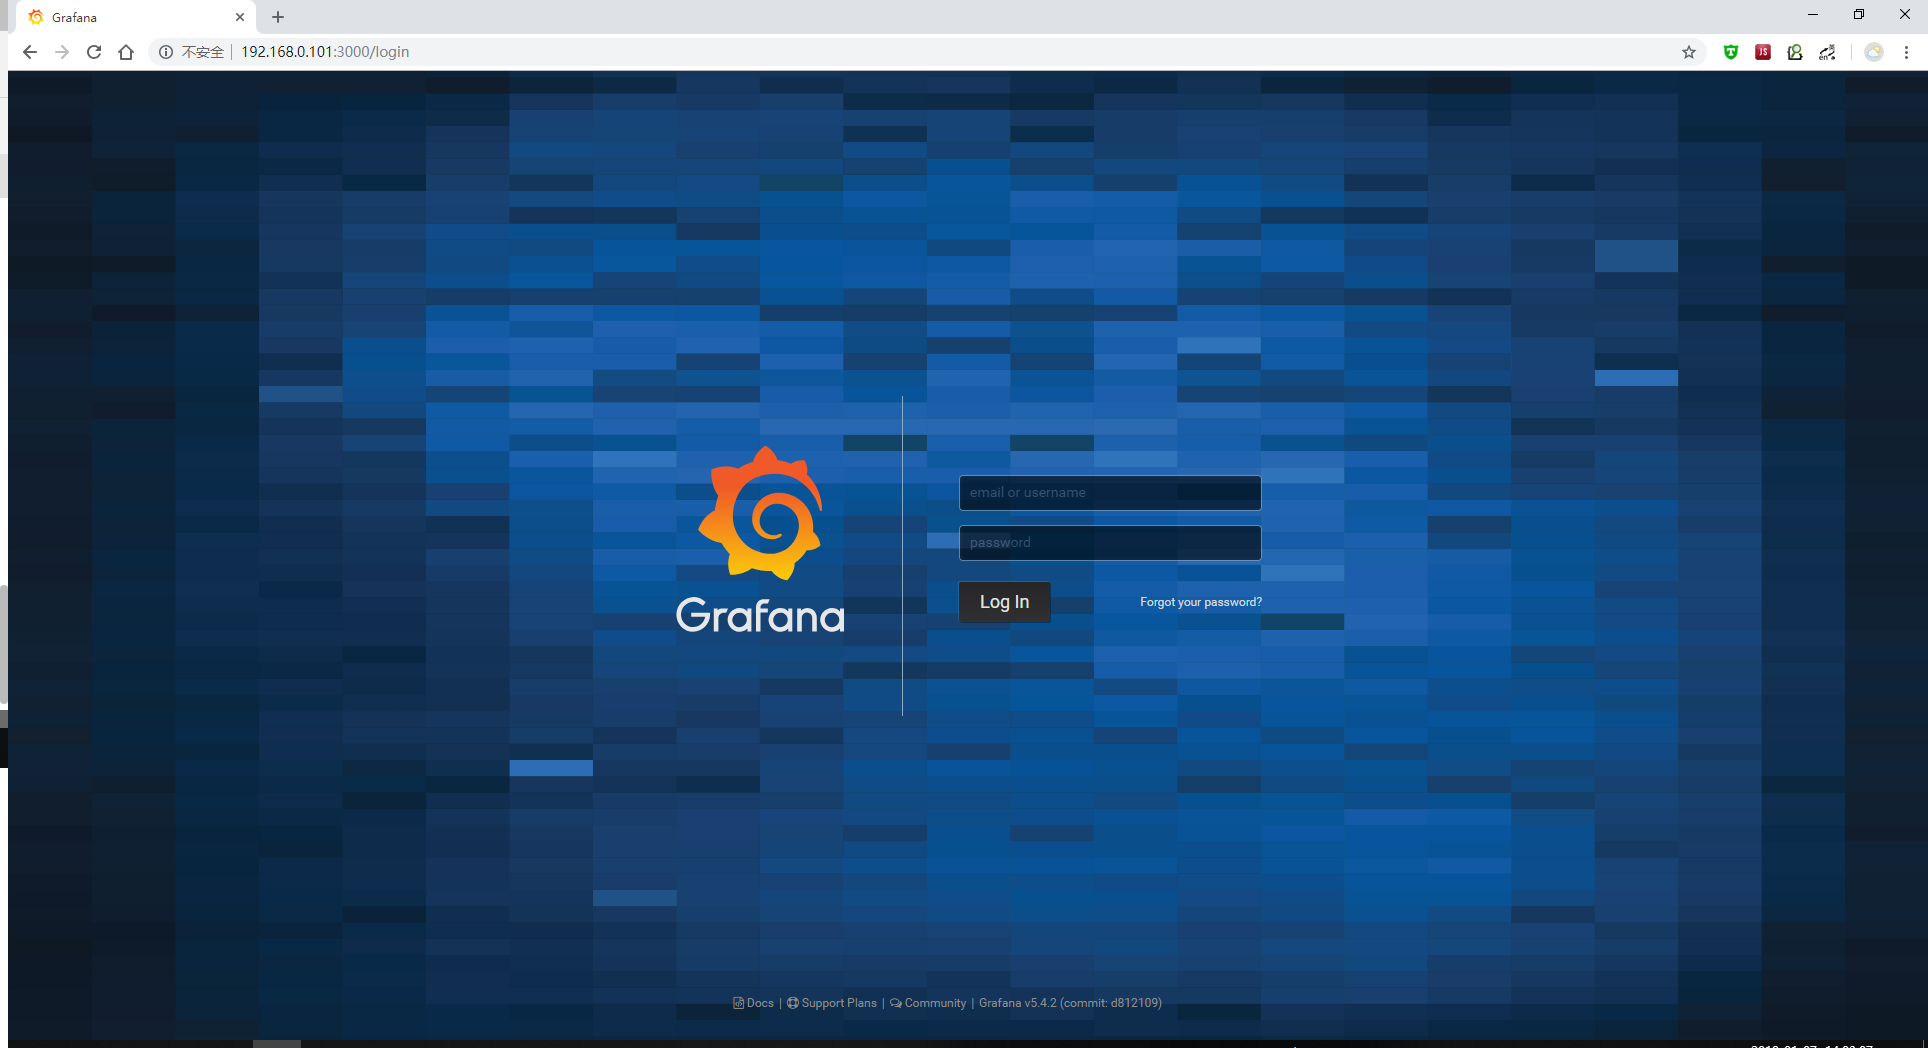
3、访问grafana
浏览器访问IP:3000端口,即可打开grafana页面,默认用户名密码都是admin,初次登录会要求修改默认的登录密码
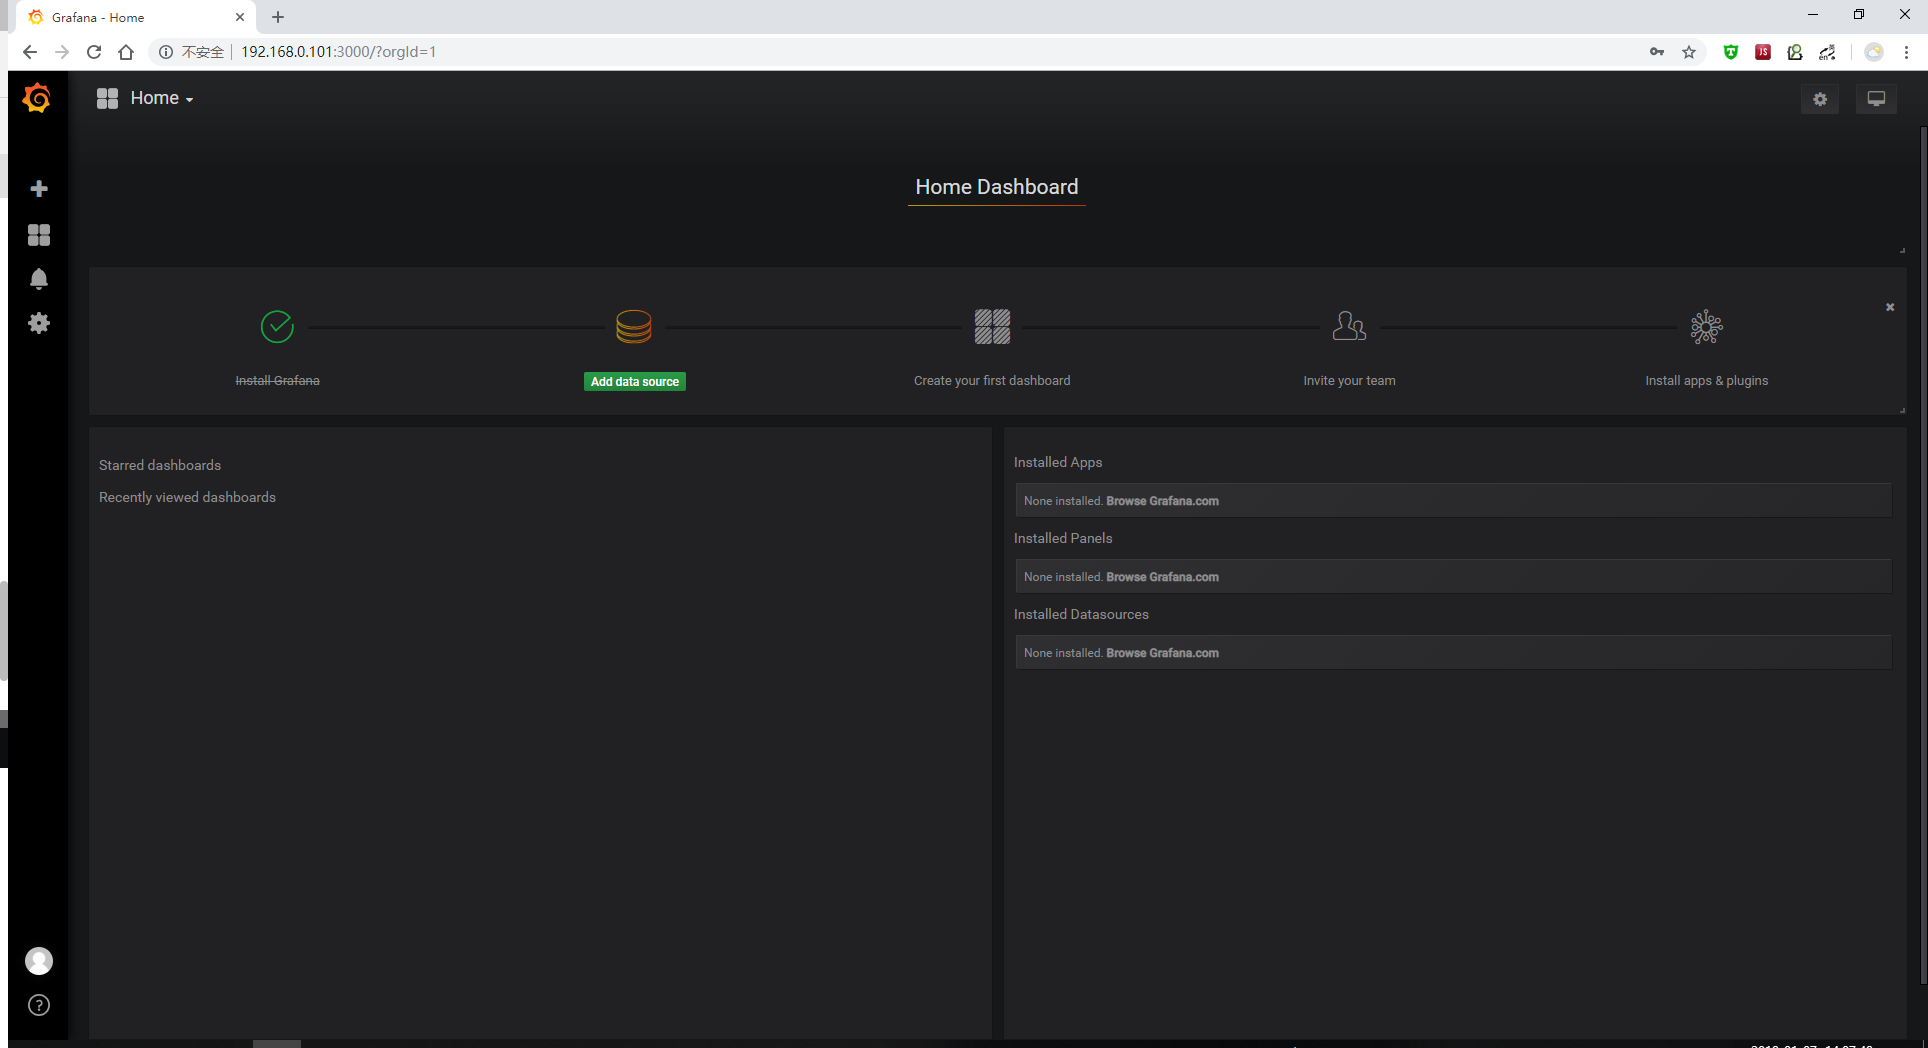
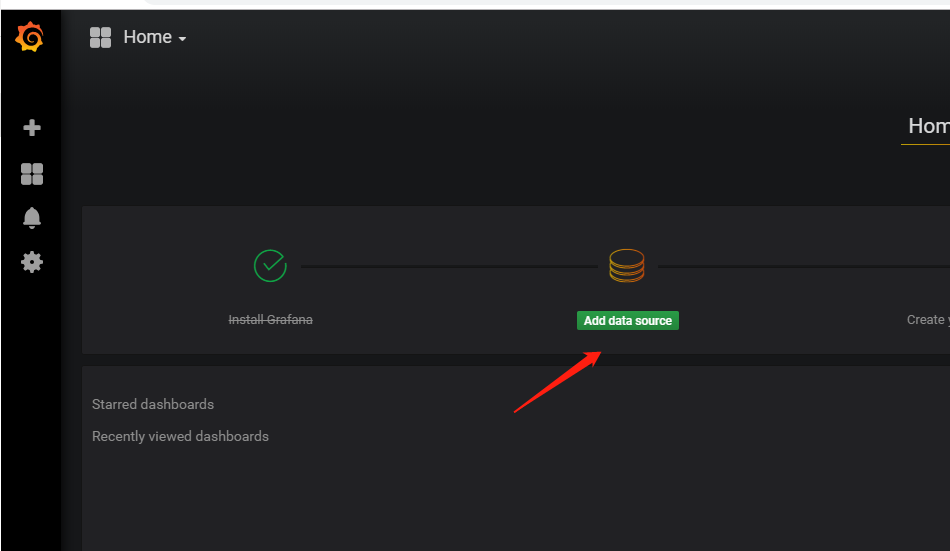
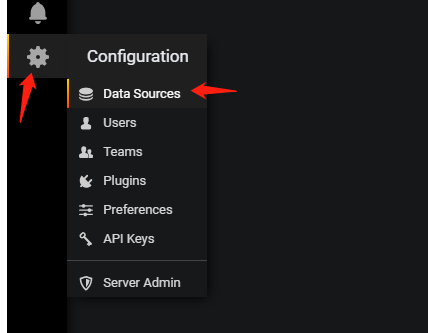
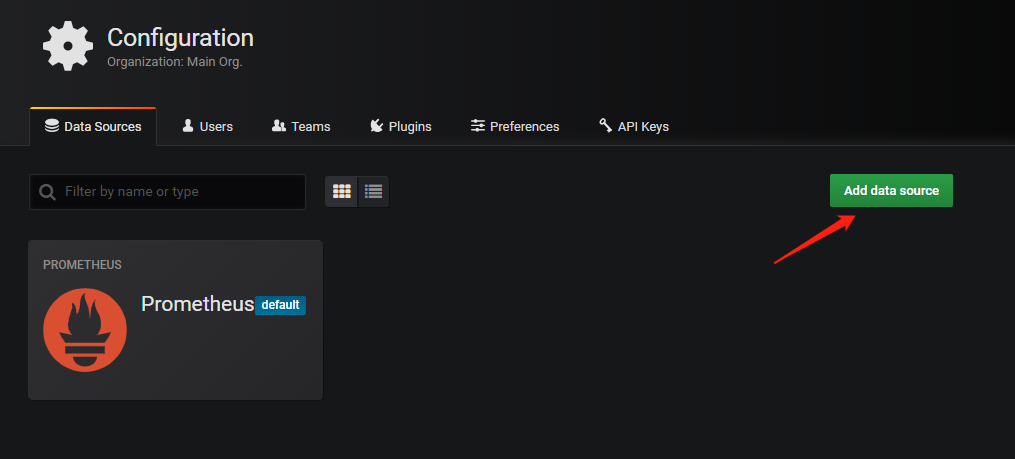
4、添加prometheus数据源
(1)点击主界面的“Add data source”
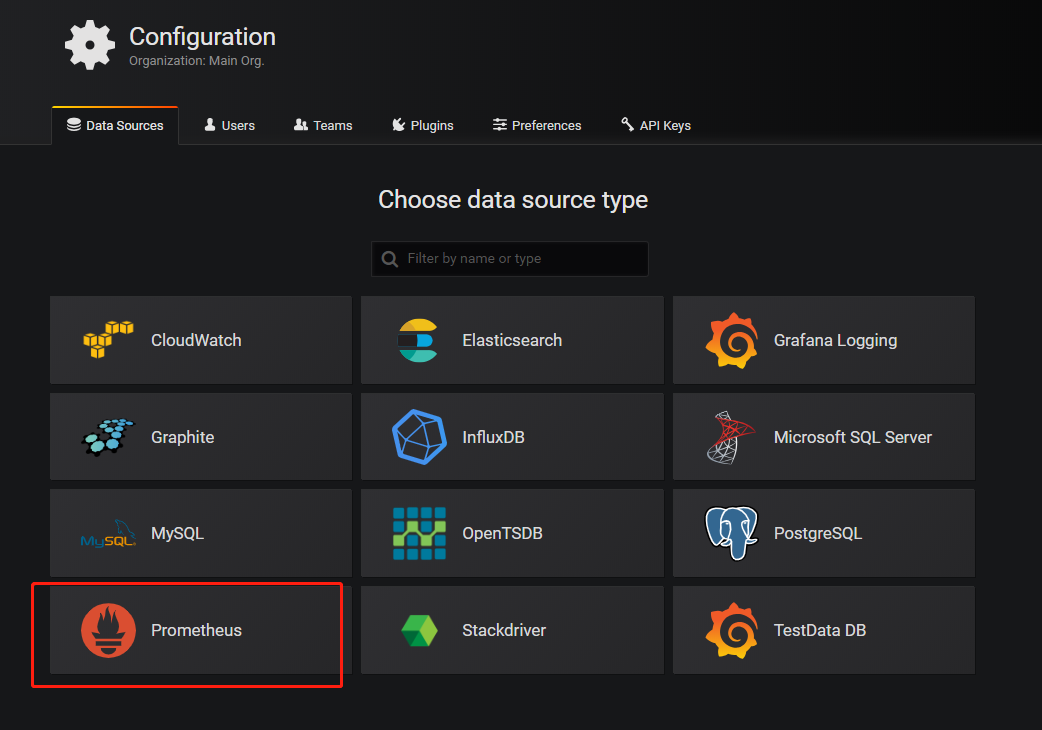
(2)选择Prometheus
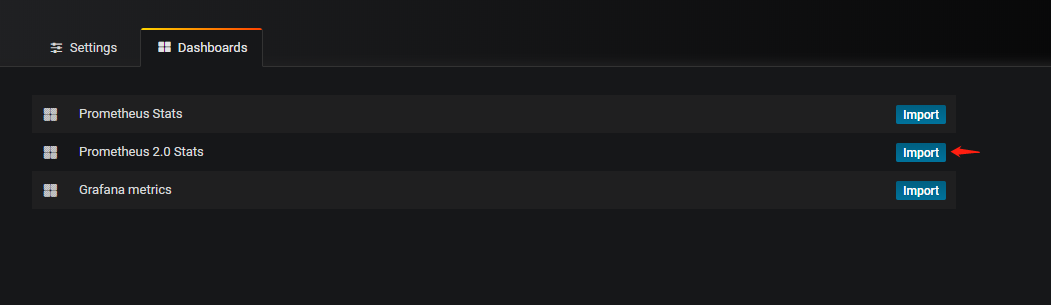
(3)Dashboards页面选择“Prometheus 2.0 Stats”
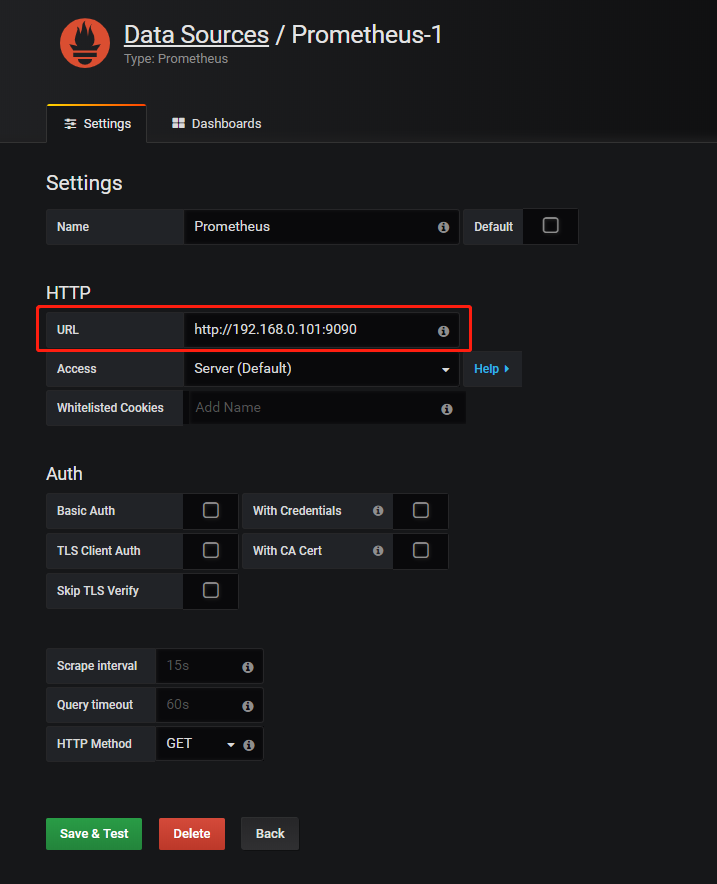
(4)Settings页面填写普罗米修斯地址并保存
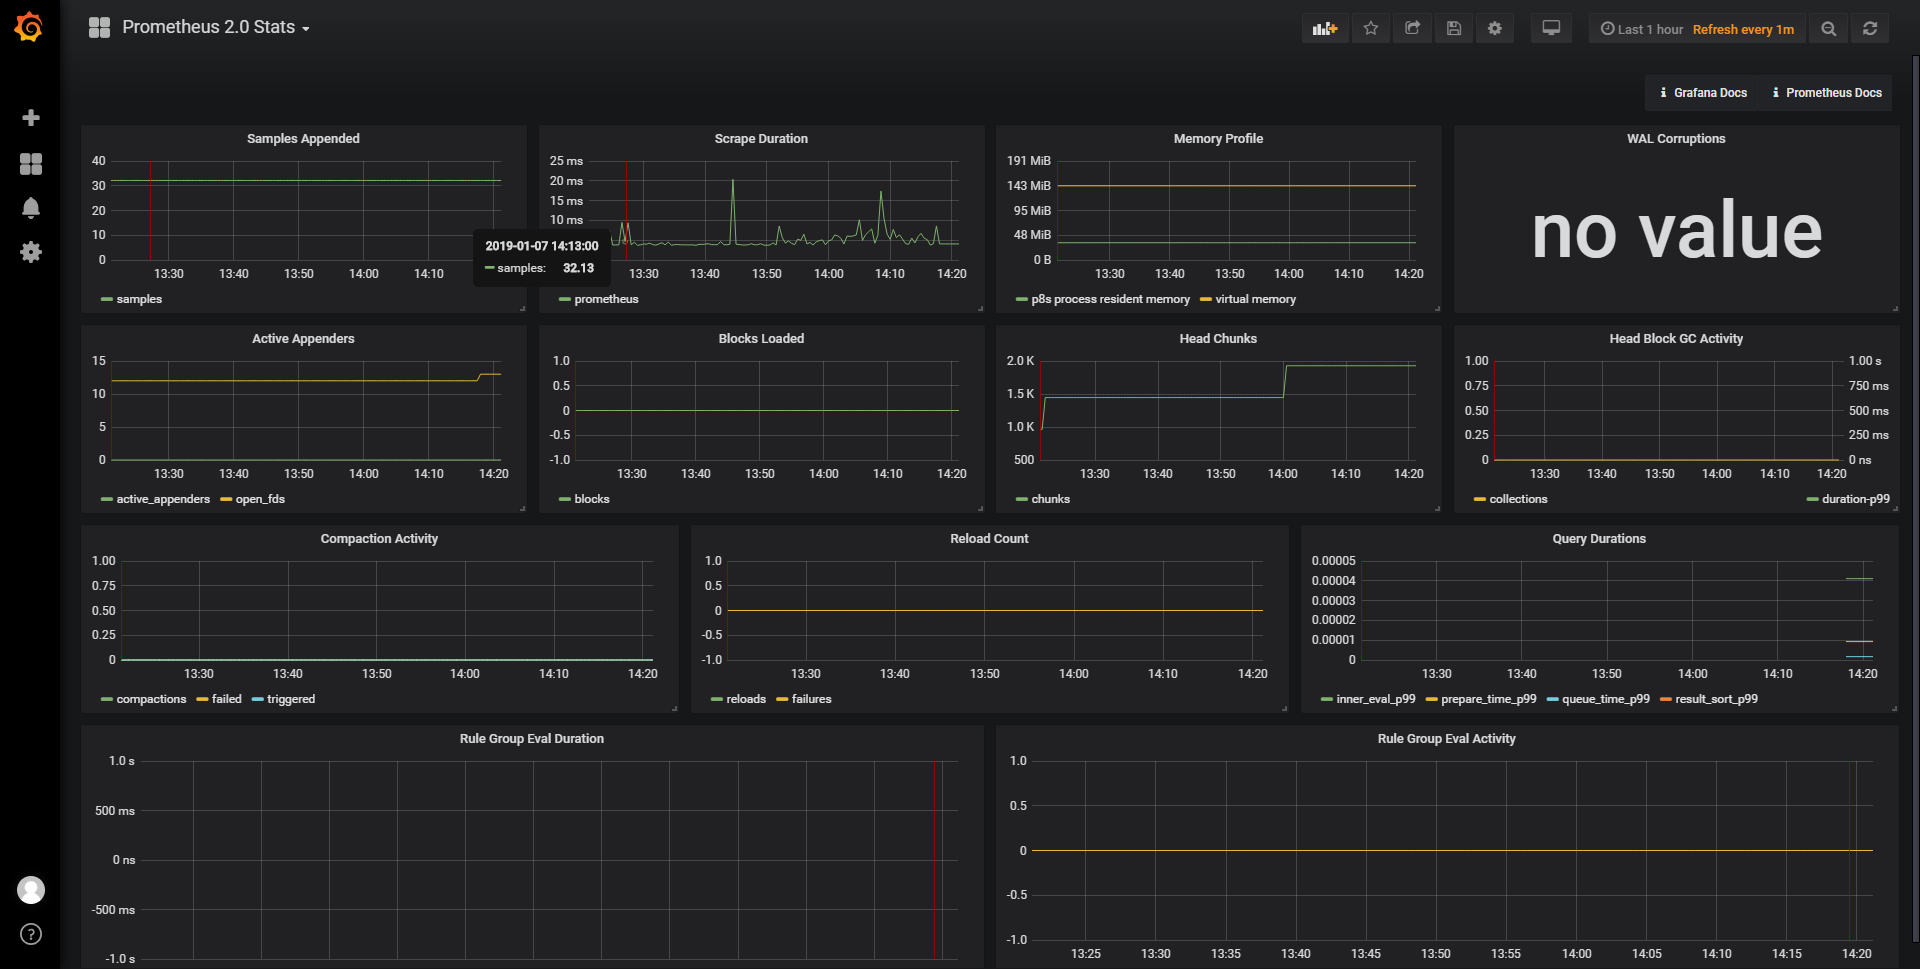
(5)切换到我们刚才添加的“Prometheus 2.0 Stats”即可看到整个监控页面
五、一些常用监控举例
1、监控linux机器(node-exporter)
https://github.com/prometheus/node_exporter/releases/download/v0.17.0/node_exporter-0.17.0.linux-amd64.tar.gz
(1)被监控的机器安装node-exporter
tar -xvf node_exporter-0.17.0.linux-amd64.tar.gz -C /usr/local/
(2)启动node-exporter
/usr/local/node_exporter-0.17.0.linux-amd64/node_exporter &
(3)普罗米修斯配置文件添加监控项
vim /usr/local/Prometheus/prometheus.yml
默认node-exporter端口为9100
  - job_name: 'Prometheus'
    static_configs:
    - targets: ['192.168.0.102:9100']
      labels:
        instance: Prometheus
重启普罗米修斯
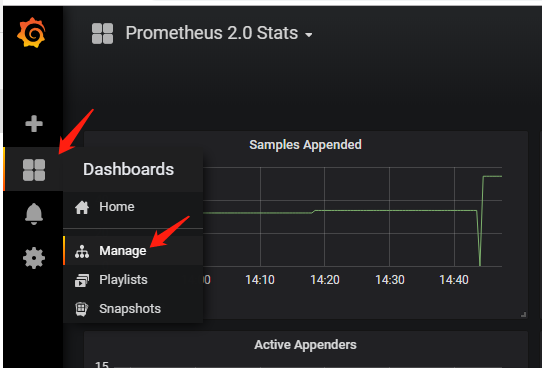
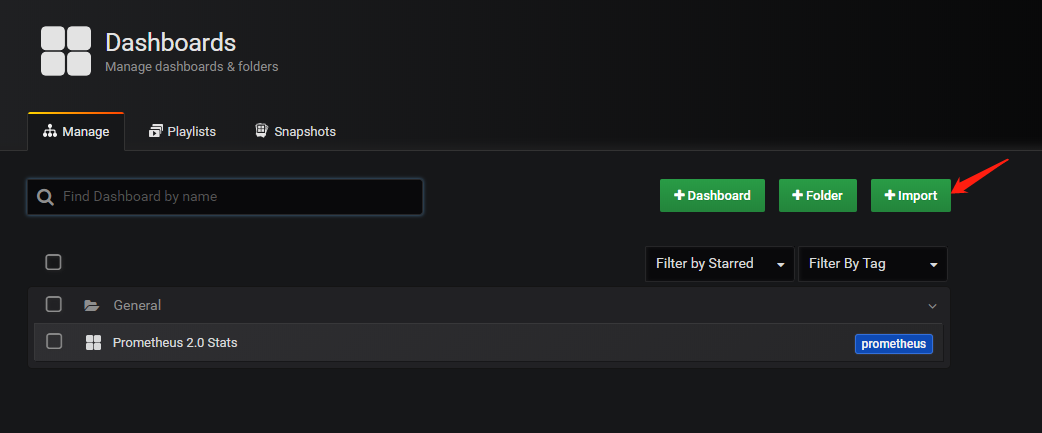
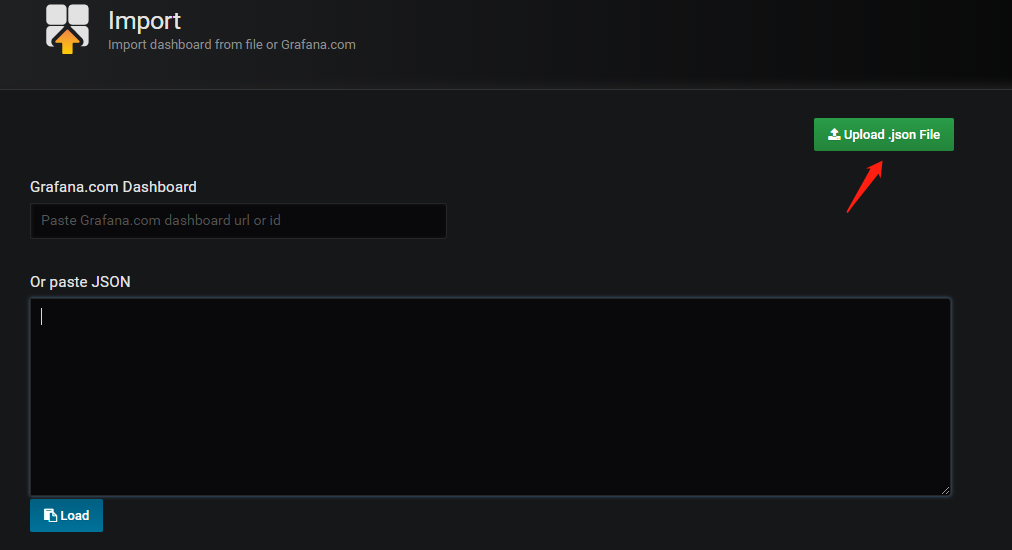
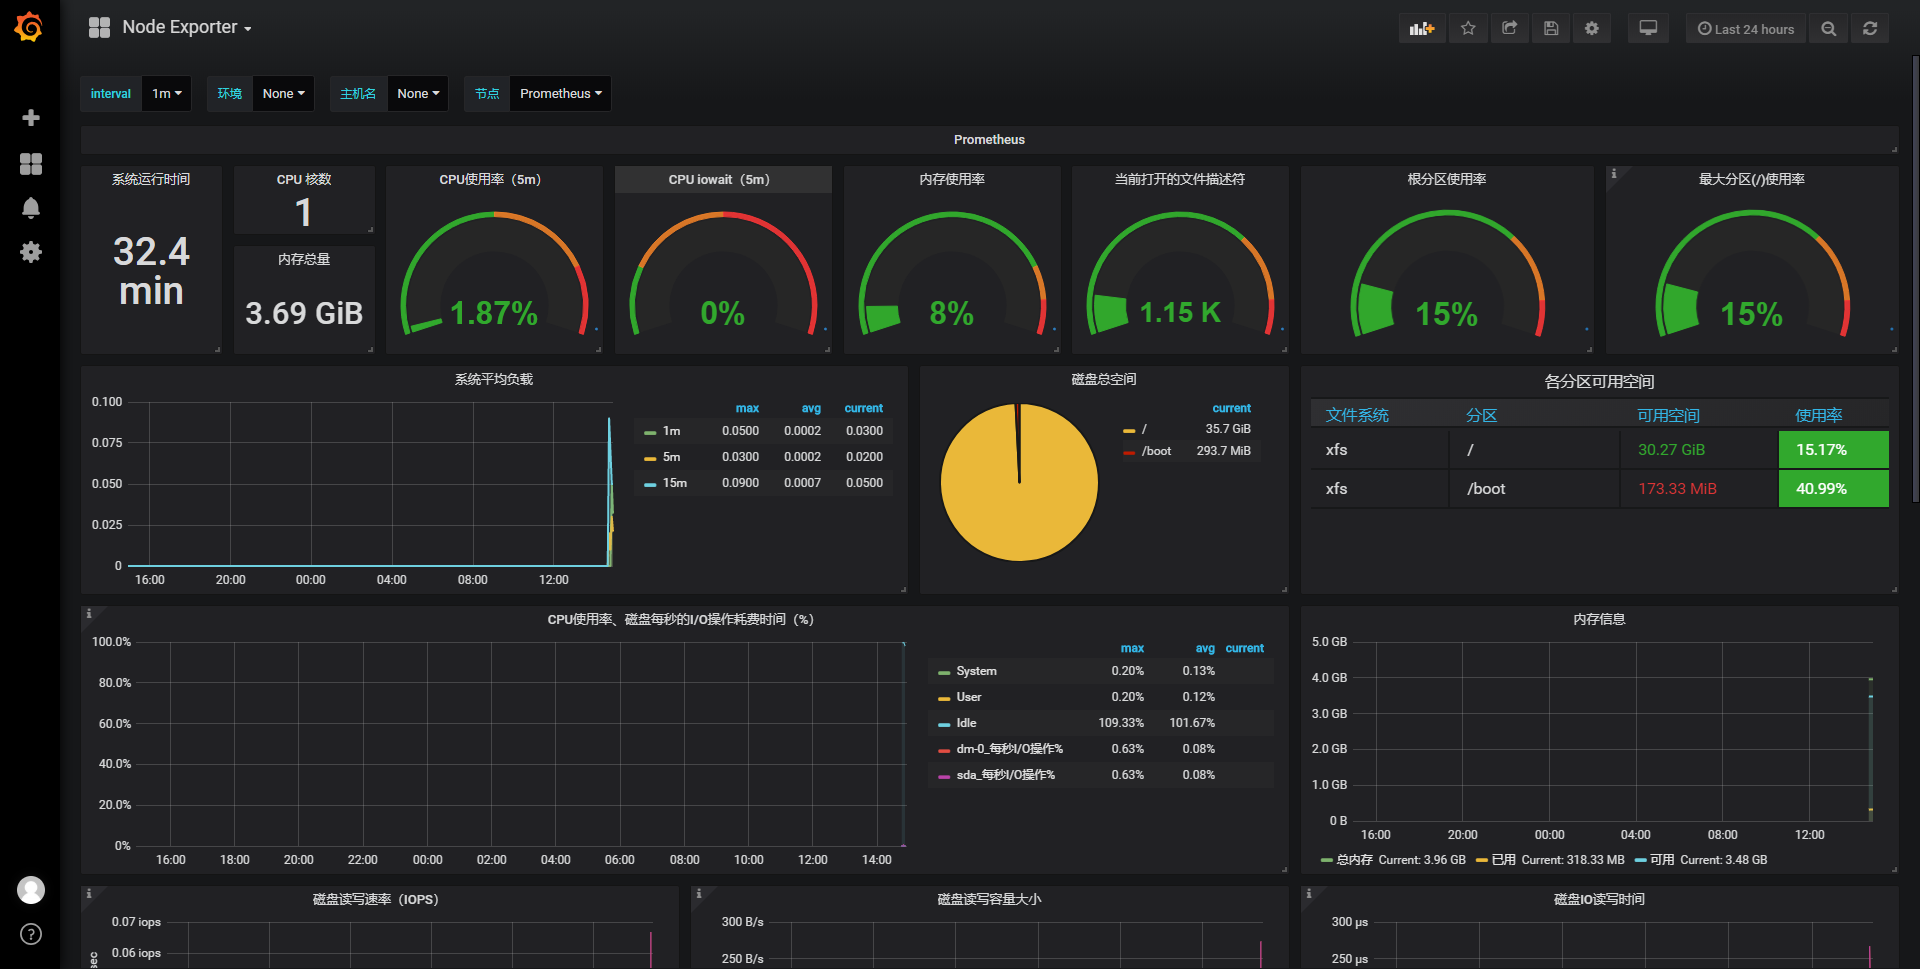
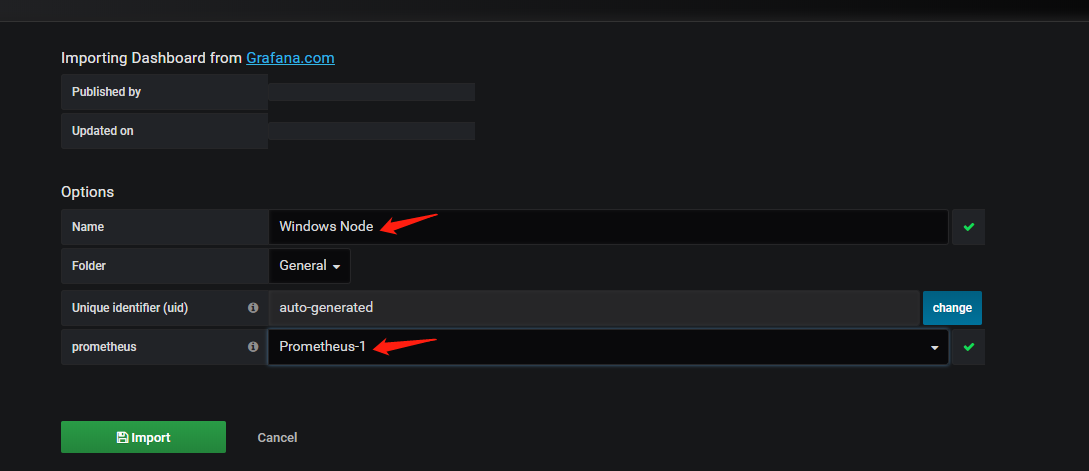
(4)grafana导入画好的dashboard
- dashboard json
- 链接:https://pan.baidu.com/s/1Dlm0IHTgRmc0q2P82cDjKg 提取码:myv6
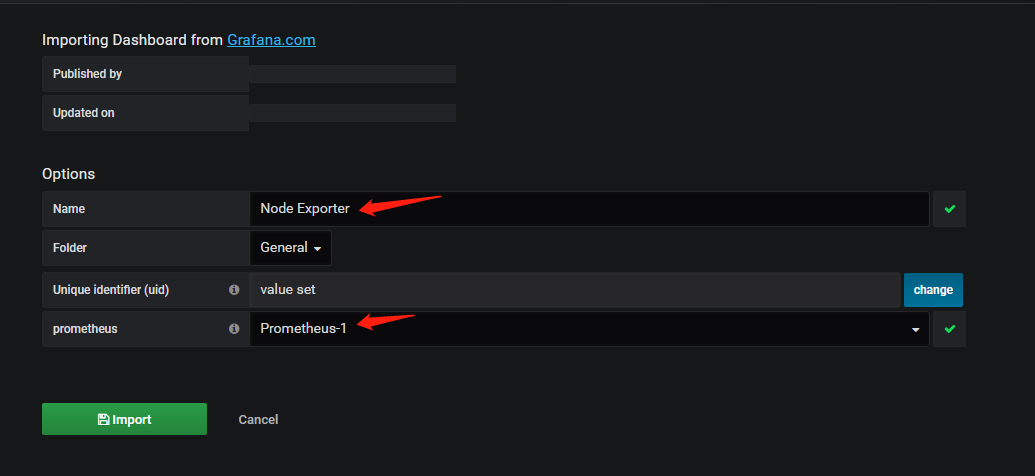
修改名字,选择我们前文创建好的数据源,点击导入即可
如果没有任何显示,是grafana缺少相关显示需要用到的插件piechart,grafana的默认插件目录是/var/lib/grafana/plugins,可以将下载好的插件解压到这个目录,重启grafana即可 - piechart插件:
- 链接:https://pan.baidu.com/s/1tvZWI9vhAqvJhojKmDlmew 提取码:tlyl
service grafana-server restart
/usr/sbin/grafana-cli plugins ls  #查看已安装插件
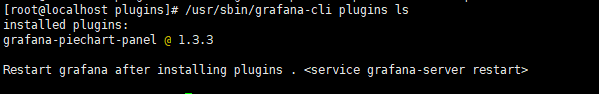
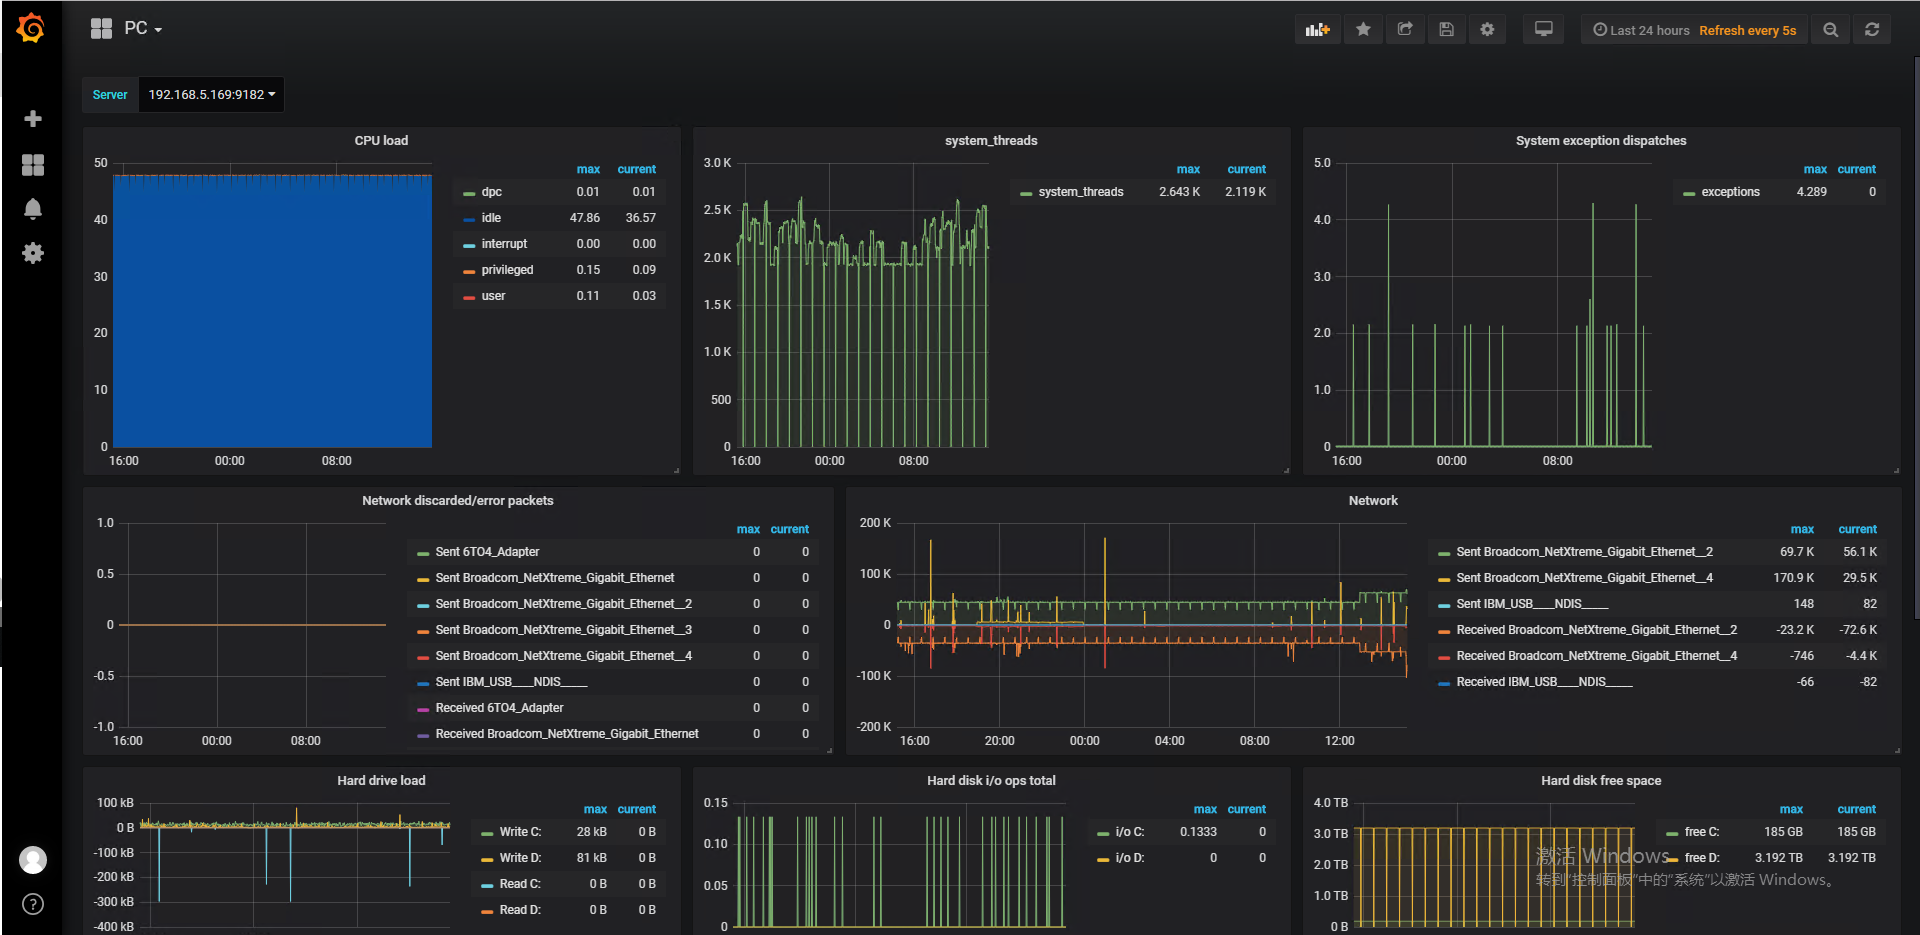
再刷新grafana页面,即可看到我们刚才设置好的node监控
2、监控windows机器(wmi-exporter)
https://github.com/martinlindhe/wmi_exporter/releases
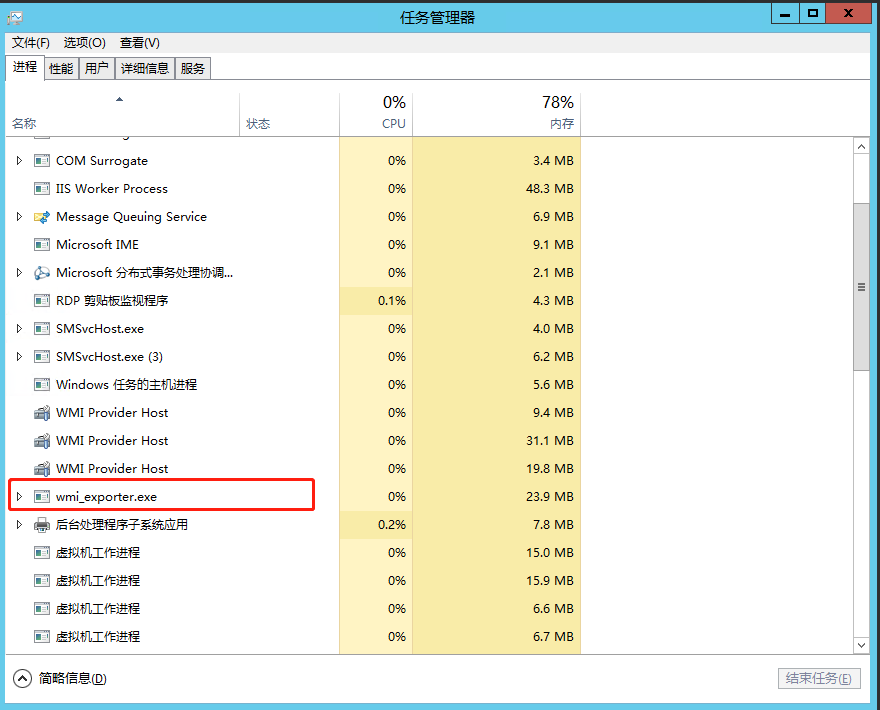
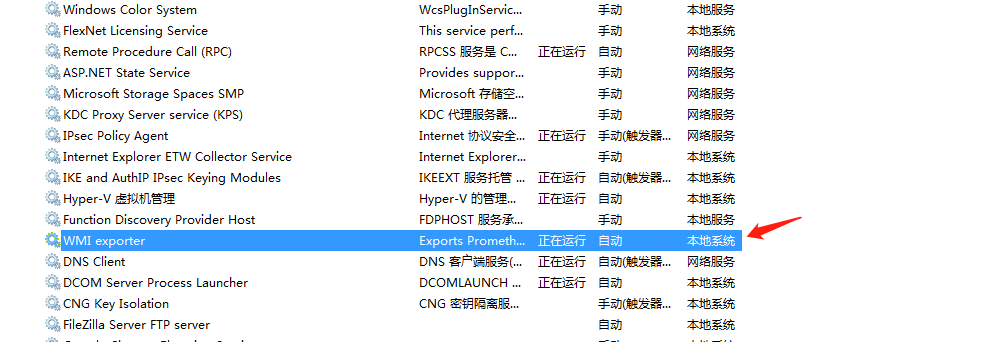
(1)被监控windows机器安装wmi-exporter,会自动创建一个开机自启的服务
(2)普罗米修斯配置文件添加配置项
vim /usr/local/Prometheus/prometheus.yml
默认wmi-exporter端口为9182
  - job_name: 'Prometheus'
    static_configs:
    - targets: ['192.168.0.102:9182']
重启普罗米修斯
(3)grafana导入画好的dashboard,选择普罗米修斯数据源
- 链接:https://pan.baidu.com/s/1nfTE2dqcr6NYldlBm_lnfw 提取码:ohv4
3、监控MySQL(mysqld-exporter)
https://github.com/prometheus/mysqld_exporter/releases/download/v0.11.0/mysqld_exporter-0.11.0.linux-amd64.tar.gz
(1)被监控mysql机器安装mysqld-exporter
tar -C /usr/local/ -xvf mysqld_exporter-0.11.0.linux-amd64.tar.gz
(2)设置配置文件,user为数据库登录用户,password为这个用户的密码
vi .my.cnf

[client]
user=root
password=123456
(3)启动mysqld-exporter
/usr/local/mysqld_exporter-0.11.0.linux-amd64/mysqld_exporter --config.my-cnf="/usr/local/mysqld_exporter-0.11.0.linux-amd64/.my.cnf" &
(4)prometheus配置文件中加入mysql监控并重启
vim /usr/local/Prometheus/prometheus.yml
默认mysqld-exporter端口为9104
- job_name: 'MySQL'
    static_configs:
    - targets: ['192.168.0.103:9104']
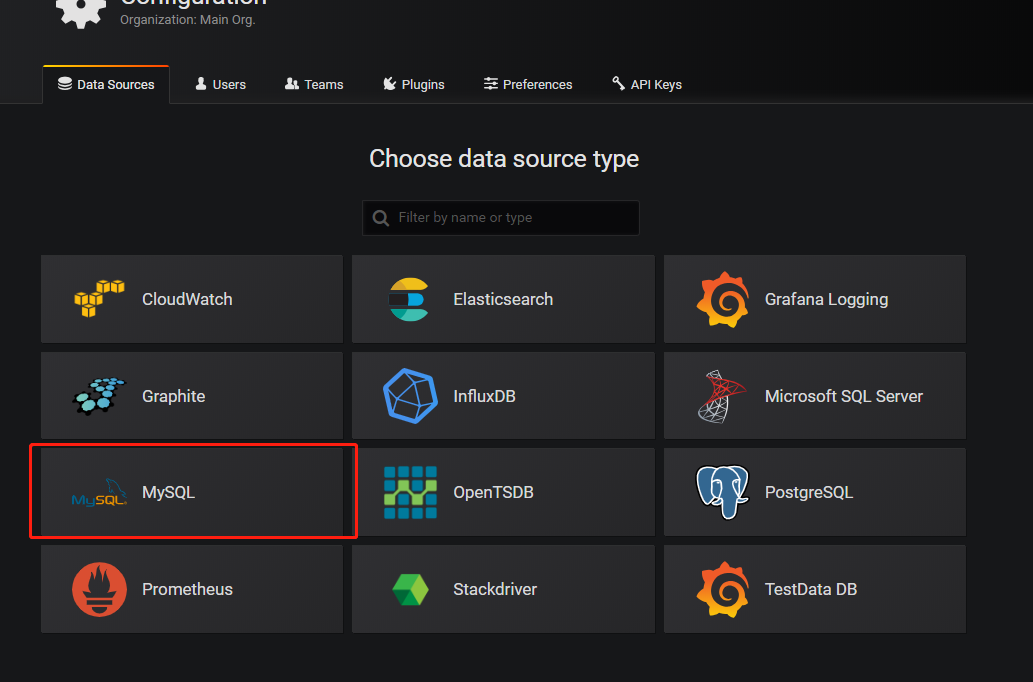
(5)设置数据源
grafana界面添加mysql数据源
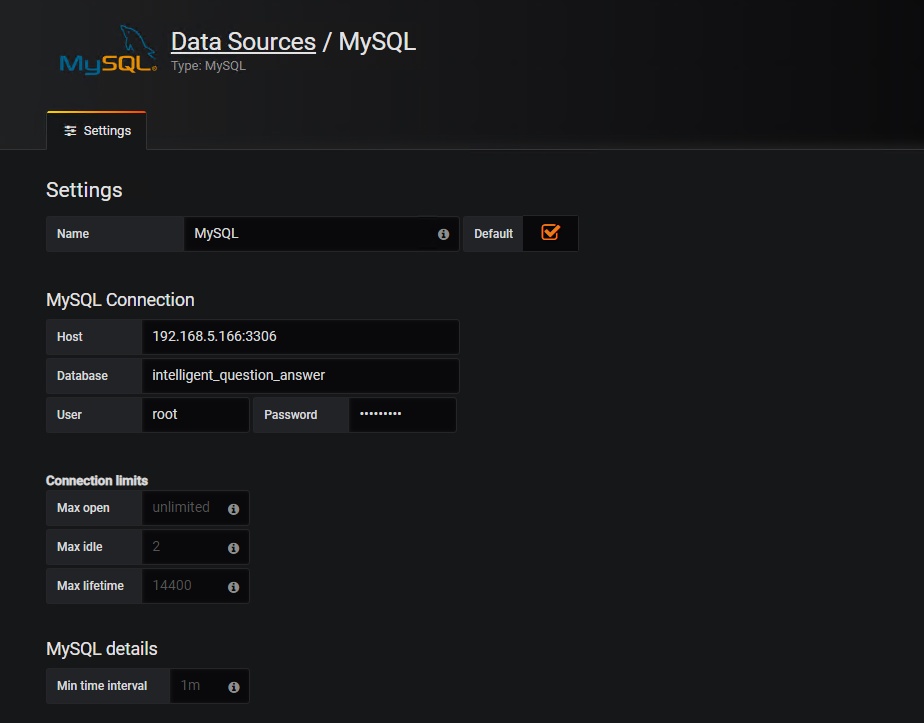
添加需要被监控的数据库及相关信息
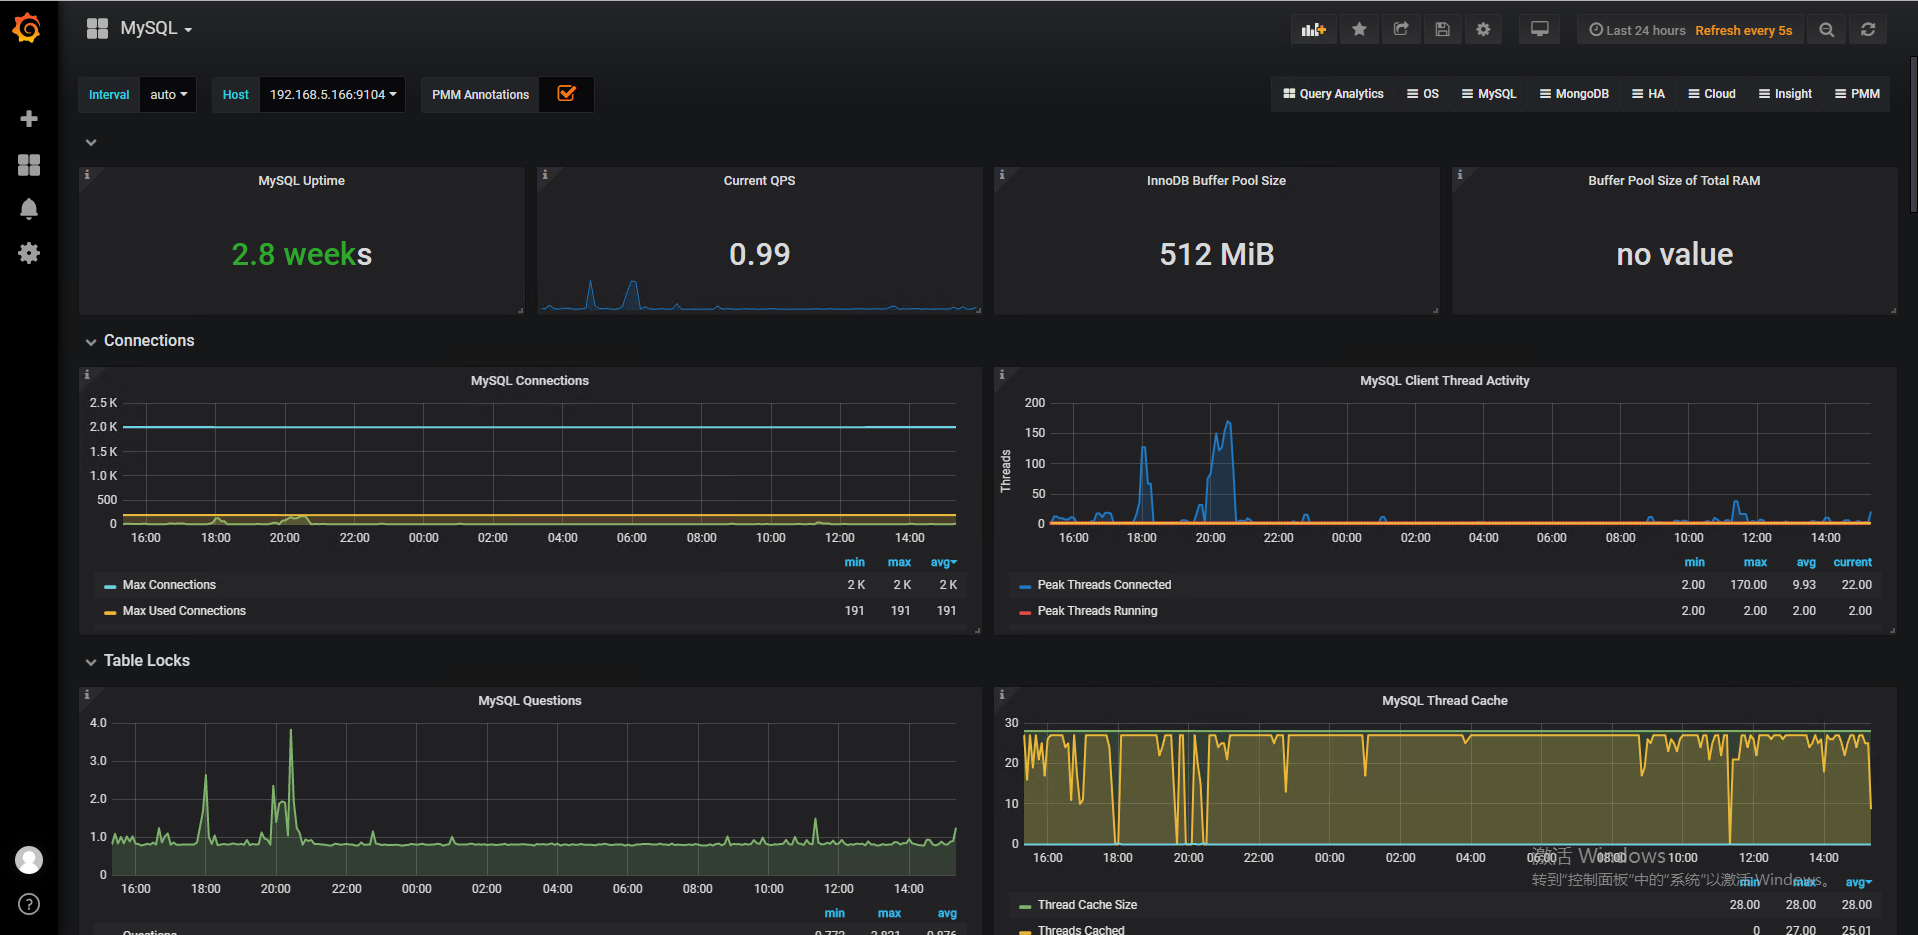
(6)导入已经画好的dashboard,数据源选择刚刚创建好的mysql数据源即可
- 链接:https://pan.baidu.com/s/1GBzogDLsYS3IvwH4WbdPLw 提取码:ef6e
4、监控Redis(redis_exporter)
链接:https://pan.baidu.com/s/12y7HxtQlBjFwr_i8ClM8Kw 提取码:13v2
(1)安装redis_exporter
tar -C /usr/local/ -xvf redis_exporter-v0.15.0.linux-amd64.tar.gz
(2)启动redis_exporter
默认redis_exporter端口为9121
./redis_exporter redis//192.168.0.103:6379 & -web.listenaddress 192.168.0.103:9121
(3)prometheus配置文件中加入redis监控并重启
vim /usr/local/Prometheus/prometheus.yml
默认redis-exporter端口为9121
- job_name: 'Redis'
    static_configs:
    - targets: ['192.168.0.103:9121']
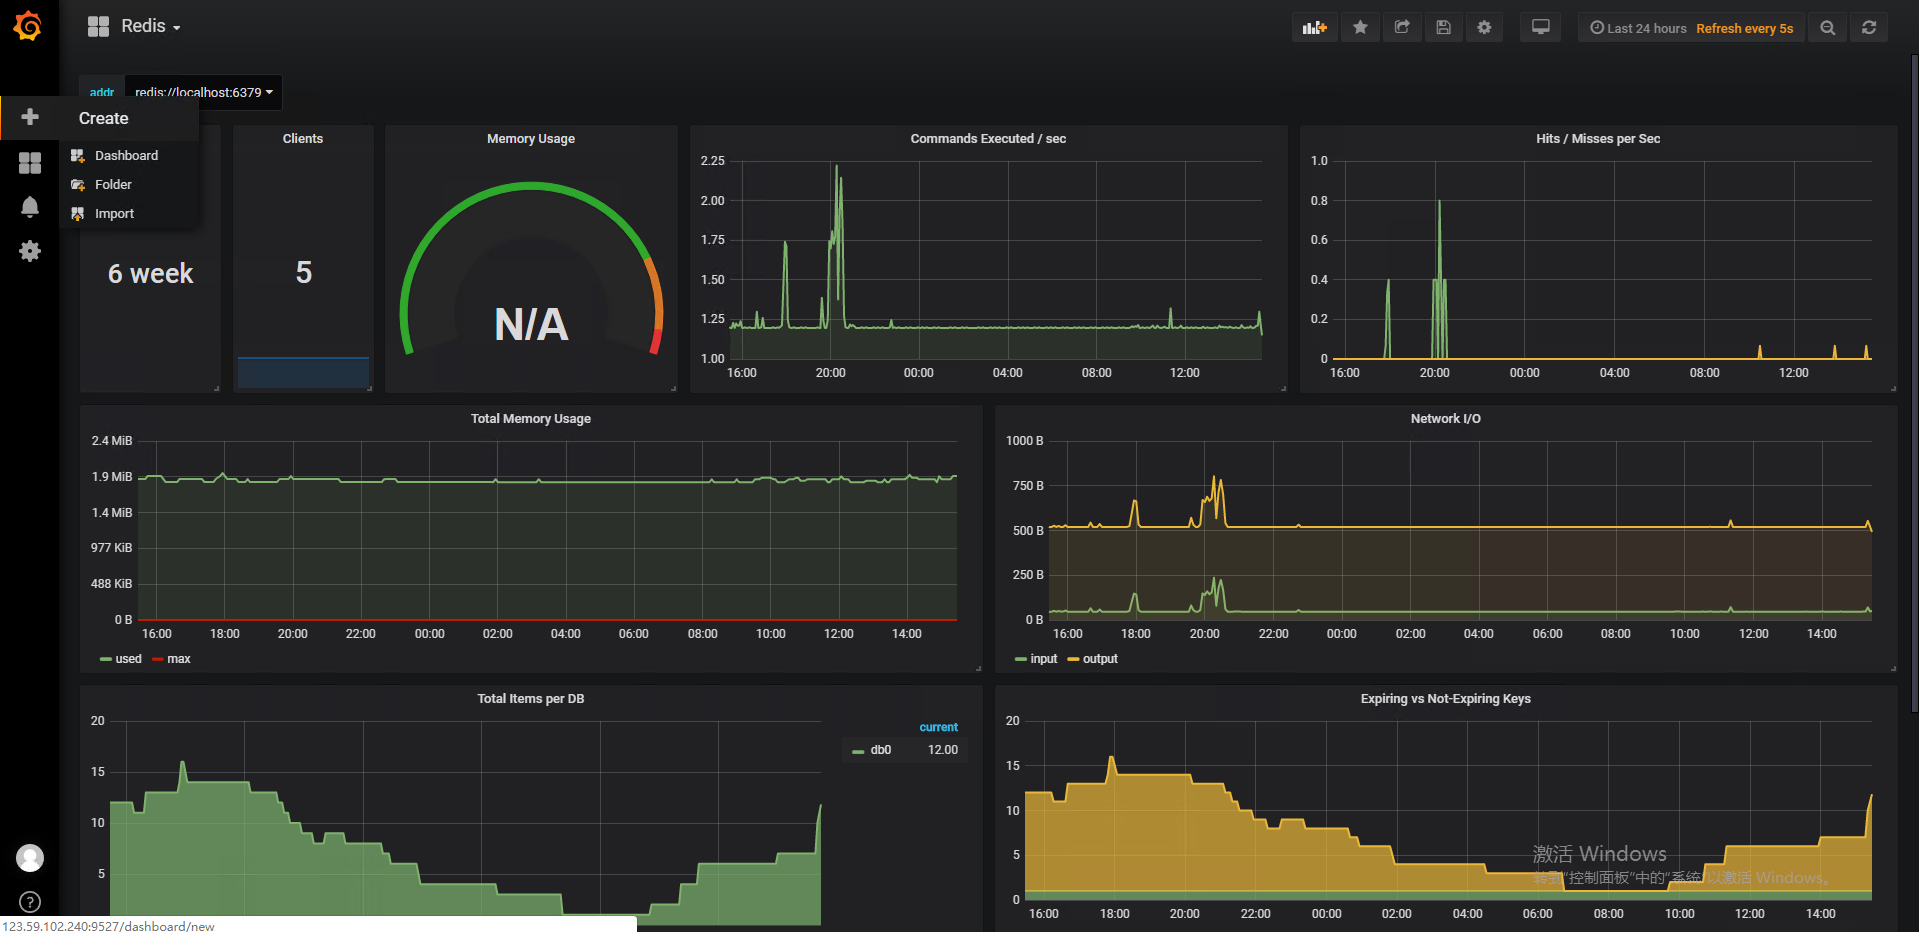
(4)grafana导入画好的dashboard
- 链接:https://pan.baidu.com/s/1LIkVC0o3lyTT59JbX0mSpg 提取码:gf1d
六、一些网站
- grafana dashboard:https://grafana.com/dashboards
- grafana plugins:https://grafana.com/plugins
发布者:全栈程序员-站长,转载请注明出处:https://javaforall.net/133204.html原文链接:https://javaforall.net


