
大家好,又见面了,我是你们的朋友全栈君。
plt.subplot()
plt.subplot(nrows, ncols, index, **kwargs)
-
第一个参数:*args (官网文档描述)
Either a 3-digit integer or three separate integers describing the position of the subplot. If the three integers are nrows, ncols, and index in order, the subplot will take the index position on a grid with nrows rows and ncols columns. index starts at 1 in the upper left corner and increases to the right.
可以使用三个整数,或者三个独立的整数来描述子图的位置信息。如果三个整数是行数、列数和索引值,子图将分布在行列的索引位置上。索引从1开始,从右上角增加到右下角。
pos is a three digit integer, where the first digit is the number of rows, the second the number of columns, and the third the index of the subplot. i.e. fig.add_subplot(235) is the same as fig.add_subplot(2, 3, 5). Note that all integers must be less than 10 for this form to work.
位置是由三个整型数值构成,第一个代表行数,第二个代表列数,第三个代表索引位置。举个列子:plt.subplot(2, 3, 5) 和 plt.subplot(235) 是一样一样的。需要注意的是所有的数字不能超过10。 -
第二个参数:projection : {None, ‘aitoff’, ‘hammer’, ‘lambert’, ‘mollweide’, ‘polar’, ‘rectilinear’, str}, optional
The projection type of the subplot (Axes). str is the name of a costum projection, see projections. The default None results in a ‘rectilinear’ projection.
可选参数:可以选择子图的类型,比如选择polar,就是一个极点图。默认是none就是一个线形图。 -
第三个参数:polar : boolean, optional
If True, equivalent to projection=‘polar’. 如果选择true,就是一个极点图,上一个参数也能实现该功能。
官方文档传送门:plt.subplot()
import matplotlib.pyplot as plt
import numpy as np

x = np.linspace(1, 2, 2)
y1 = np.sin(x)

y2 = np.cos(x)

ax1 = plt.subplot(2, 2, 1, frameon = False) # 两行一列,位置是1的子图
plt.plot(x, y1, 'b--')
plt.ylabel('y1')
ax2 = plt.subplot(2, 2, 2, projection = 'polar')
plt.plot(x, y2, 'r--')
plt.ylabel('y2')
plt.xlabel('x')
plt.subplot(2, 2, 3, sharex = ax1, facecolor = 'red')
plt.plot(x, y2, 'r--')
plt.ylabel('y2')

plt.show()
以上代码画图如下:
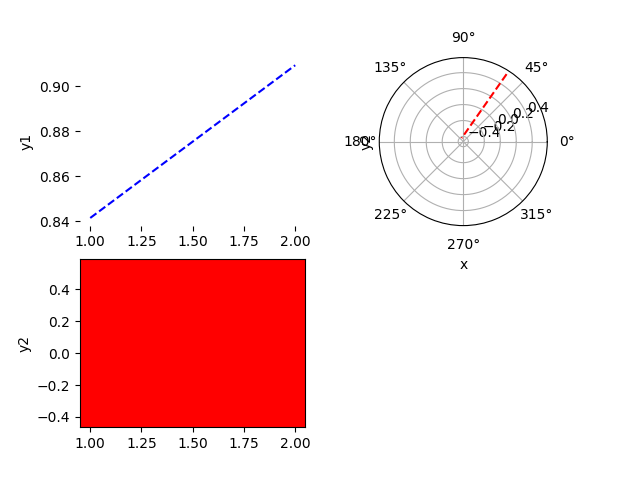

可以看到plt.subplot()可以依次画出这些子图,优点是简单明了,缺点是略显麻烦。
发布者:全栈程序员-站长,转载请注明出处:https://javaforall.net/150508.html原文链接:https://javaforall.net


