

环境 : 一台 centos7.3 IP地址:192.168.0.209
软件版本 : ElasticSearch 6.3.2 Logstash 6.3.2 Kibana 4.3.1 JDK 1.8.0_181
下载好JDK 放在路径/usr/local/java编辑配置文件 /etc/profile
export JAVA_HOME=/usr/local/java/jdk1.8.0_181
export PATH=$JAVA_HOME/bin:$PATH
加入这两句以后 然后 source /etc/profile
确认生效 java -version
[root@localhost ~]# java -version
java version “1.8.0_181”
Java(TM) SE Runtime Environment (build 1.8.0_181-b13)
Java HotSpot(TM) 64-Bit Server VM (build 25.77-b13, mixed mode)
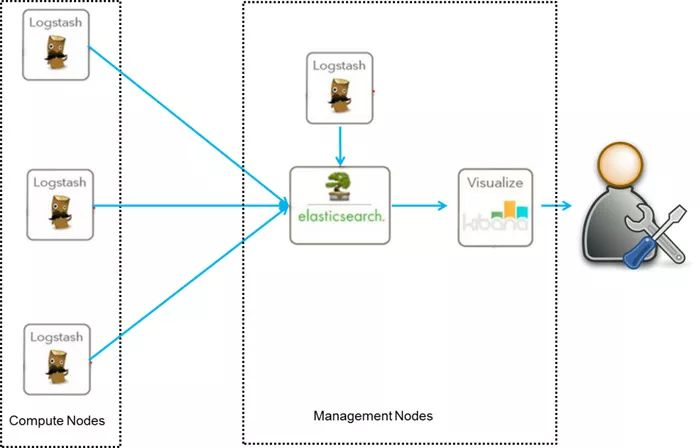
1、 搭建 ElasticSearch
下载ElasticSearch
wget https://artifacts.elastic.co/downloads/elasticsearch/elasticsearch-6.3.2.tar.gz tar -xvf elasticsearch-6.3.2.tar.gz -C /usr/local/elasticsearch-6.3.2/创建用户,并将ElasticSearch安装权限归新用户所有
useradd feiyu passwd feiyu chown -R feiyu:feiyu elasticsearch-6.3.2/修改配置
vi config/elasticsearch.yml network.host: 你自己的服务器ip http.port: 9200启动
[feiyu@localhost elasticsearch-6.3.2]$ bin/elasticsearch -d测试
[feiyu@localhost elasticsearch-6.3.2]$ curl http://192.168.0.209:9200 { "name" : "a-_Hcd6", "cluster_name" : "elasticsearch", "cluster_uuid" : "0f60tE6DSZWBa0xll4SoSA", "version" : { "number" : "6.3.2", "build_flavor" : "default", "build_type" : "tar", "build_hash" : "053779d", "build_date" : "2018-07-20T05:20:23.Z", "build_snapshot" : false, "lucene_version" : "7.3.1", "minimum_wire_compatibility_version" : "5.6.0", "minimum_index_compatibility_version" : "5.0.0" }, "tagline" : "You Know, for Search" }

可能遇到的错误:
问题1: max file descriptors [4096] for elasticsearch process is too low, increase to at least [65536] 解决方法: #切换到root用户修改 vim /etc/security/limits.conf # 在最后面追加下面内容 feiyu hard nofile 65536 feiyu soft nofile 65536 修改后重新登录 feiyu用户,使用如下命令查看是否修改成功 ulimit -Hn 65536 问题: max virtual memory areas vm.max_map_count [65530] is too low, increase to at least [] 解决方法 提高vm.max_map_count 的大小 # 切换到root用户 vim /etc/sysctl.conf # 在最后面追加下面内容 vm.max_map_count= # 使用 sysctl -p 查看修改后的结果 sysctl -p 问题: Java HotSpot(TM) 64-Bit Server VM warning: INFO: os::commit_memory(0x00000000, , 0) failed; error='Cannot allocate memory' (errno=12) 解决方法: # 由于elasticsearch5.0默认分配jvm空间大小为2g,修改jvm空间分配 # 如果使用虚拟机安装,内存最好不小于2G # vim config/jvm.options -Xms512m -Xmx512m安装elasticsearch-head插件
安装docker镜像或者通过github下载elasticsearch-head项目都是可以的,1或者2两种方式选择一种安装使用即可
1. 使用docker的集成好的elasticsearch-head
docker run -p 9100:9100 mobz/elasticsearch-head:5 yum install -y epel git yum install -y npm git clone git://github.com/mobz/elasticsearch-head.git cd elasticsearch-head npm install npm run start

2、搭建NGINX
请参照《Centos7下Nginx编译安装与脚本安装的记录》
vim /usr/local/nginx/conf/nginx.conf
#user  nobody;
worker_processes  1;

#error_log  logs/error.log  notice;
#error_log  logs/error.log  info;

#pid        logs/nginx.pid;


events {
   worker_connections  1024;
}

http {

    upstream kibana4 {  #对Kibana做代理
        server 127.0.0.1:5601 fail_timeout=0;
    }
    include       mime.types;
    default_type  application/octet-stream;

    #log_format  main  '$remote_addr - $remote_user [$time_local] "$request" '
    #                  '$status $body_bytes_sent "$http_referer" '
    #                  '"$http_user_agent" "$http_x_forwarded_for"';

     log_format json '{"@timestamp":"$time_iso8601",'   #配置NGINX的日志格式 json
                        '"host":"$server_addr",'
                        '"clientip":"$remote_addr",'
                        '"size":$body_bytes_sent,'
                        '"responsetime":$request_time,'
                        '"upstreamtime":"$upstream_response_time",'
                        '"upstreamhost":"$upstream_addr",'
                        '"http_host":"$host",'
                        '"url":"$uri",'
                        '"xff":"$http_x_forwarded_for",'
                        '"referer":"$http_referer",'
                        '"agent":"$http_user_agent",'
                        '"status":"$status"}';
     access_log /var/log/nginx/access.log_json json;   #配置日志路径 json格式
     error_log /var/log/nginx/error.log;

    sendfile        on;
    #tcp_nopush     on;

    #keepalive_timeout  0;
    keepalive_timeout  65;

    #gzip  on;

    server {
        listen       80;
        server_name  localhost;

        #charset koi8-r;

        #access_log  logs/host.access.log  main;

        location / {
            root   html;
            index  index.html index.htm;
        }

        #error_page  404              /404.html;

        # redirect server error pages to the static page /50x.html
        #
        error_page   500 502 503 504  /50x.html;
        location = /50x.html {
            root   html;
        }

        # proxy the PHP scripts to Apache listening on 127.0.0.1:80
        #
        #location ~ \.php$ {
        #    proxy_pass   http://127.0.0.1;
        #}

        # pass the PHP scripts to FastCGI server listening on 127.0.0.1:9000
        #
        #location ~ \.php$ {
        #    root           html;
        #    fastcgi_pass   127.0.0.1:9000;
        #    fastcgi_index  index.php;
        #    fastcgi_param  SCRIPT_FILENAME  /scripts$fastcgi_script_name;
        #    include        fastcgi_params;
        #}

        # deny access to .htaccess files, if Apache's document root
        # concurs with nginx's one
        #
        #location ~ /\.ht {
        #    deny  all;
        #}
    }


    # another virtual host using mix of IP-, name-, and port-based configuration
    #
    #server {
    #    listen       8000;
    #    listen       somename:8080;
    #    server_name  somename  alias  another.alias;

    #    location / {
    #        root   html;
    #        index  index.html index.htm;
    #    }
    #}


    # HTTPS server
    #
    #server {
    #    listen       443 ssl;
    #    server_name  localhost;

    #    ssl_certificate      cert.pem;
    #    ssl_certificate_key  cert.key;

    #    ssl_session_cache    shared:SSL:1m;
    #    ssl_session_timeout  5m;

    #    ssl_ciphers  HIGH:!aNULL:!MD5;
    #    ssl_prefer_server_ciphers  on;

    #    location / {
    #        root   html;
    #        index  index.html index.htm;
    #    }
    #}


server {
    listen               *:80;
    server_name          kibana_server;
    access_log           /var/log/nginx/kibana.srv-log-dev.log;
    error_log            /var/log/nginx/kibana.srv-log-dev.error.log;


    location / {
        root   /var/www/kibana;
        index  index.html  index.htm;
    }

    location ~ ^/kibana4/.* {
        proxy_pass           http://kibana4;
        rewrite              ^/kibana4/(.*)  /$1 break;
        proxy_set_header     X-Forwarded-For $proxy_add_x_forwarded_for;
        proxy_set_header     Host            $host;
        auth_basic           "Restricted";
        auth_basic_user_file /etc/nginx/conf.d/kibana.myhost.org.htpasswd;
    }

}
}
3、搭建 Logstash
官方安装手册
wget https://artifacts.elastic.co/downloads/logstash/logstash-6.3.2.tar.gz tar -zxvf logstash-6.3.2.tar.gz -C /usr/local/logstash-6.3.2 cd /usr/local/logstash-6.3.2/bin vim stdin.conf #编写配置文件 input{ file { path => "/var/log/nginx/access.log_json" #NGINX日志地址 json格式 codec => "json" json编码 } } filter { mutate { split => ["upstreamtime", ","] } mutate { convert => ["upstreamtime", "float"] } } output{ elasticsearch { hosts => ["192.168.0.209:9200"] #elasticsearch地址 index => "logstash-%{type}-%{+YYYY.MM.dd}" #索引 document_type => "%{type}" workers => 1 flush_size => 20000 #传输数量 默认500 idle_flush_time => 10 #传输秒数 默认1秒 template_overwrite => true } } ./logstash -f stdin.conf & #后台启动 启动成功以后 打开刚才搭建的web服务器 es就能看到数据# logstash -e 'input { stdin { } } output { stdout {} }' 注: -e 执行操作 input 标准输入 { input } 插件 output 标准输出 { stdout } 插件
4、搭建Kibana
wget https://download.elastic.co/kibana/kibana/kibana-4.3.1-linux-x64.tar.gz tar xf kibana-4.3.1-linux-x64.tar.gz cd /usr/local/kibana-4.3.1-linux-x64/ vim ./config/kibana.yml elasticsearch.url: " 只需要修改URL为ElasticSearch的IP地址 ./kibana & 后台启动 启动成功以后 会监听 5601端口
全部搭建好了以后就可以用Kibana查看
地址 : 192.168.88.250:5601
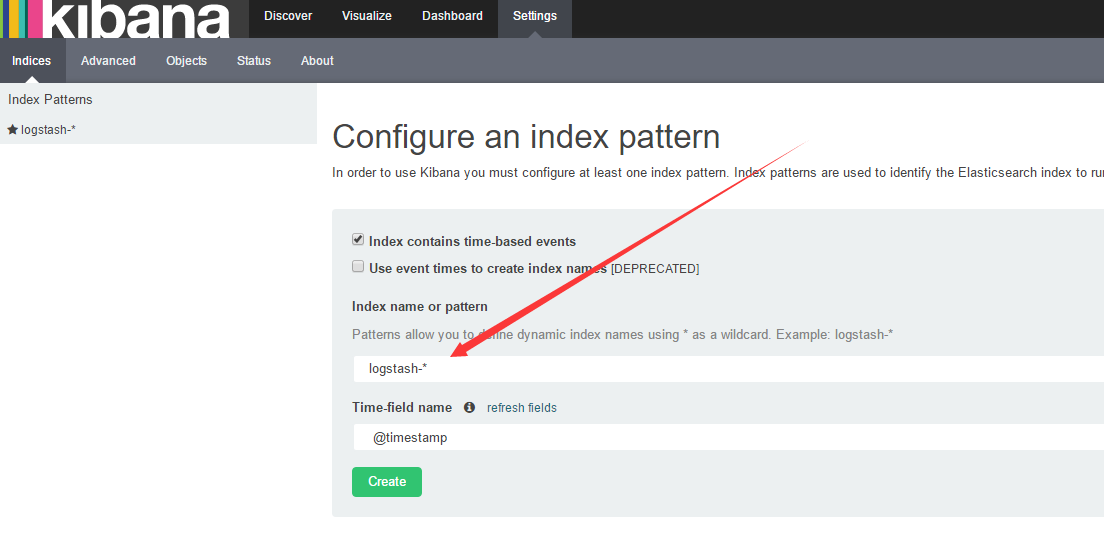
如果create灰色的 说明没有创建索引 打开你的nginx服务器 刷新几下 采集一下数据
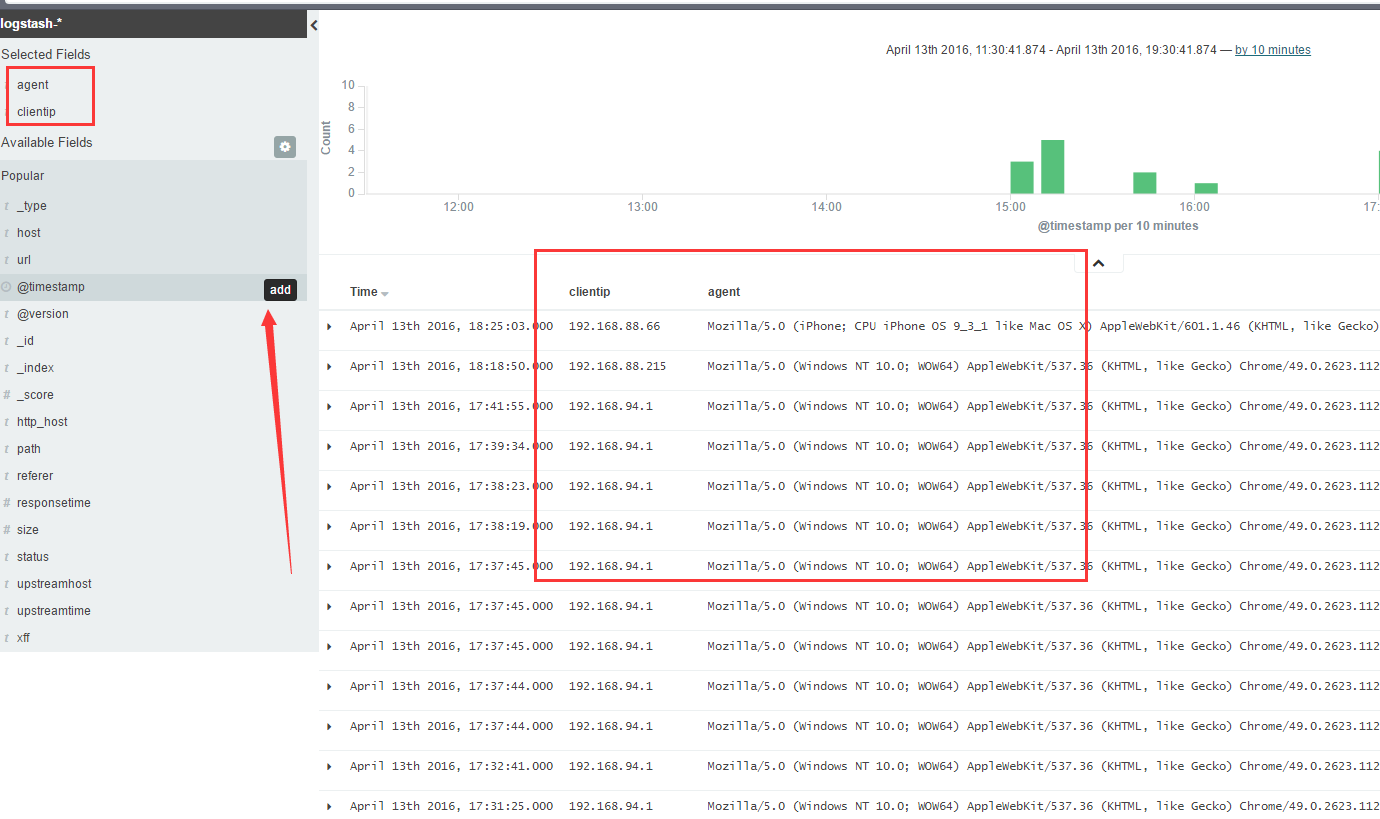
然后 选择 左上角的 Discover
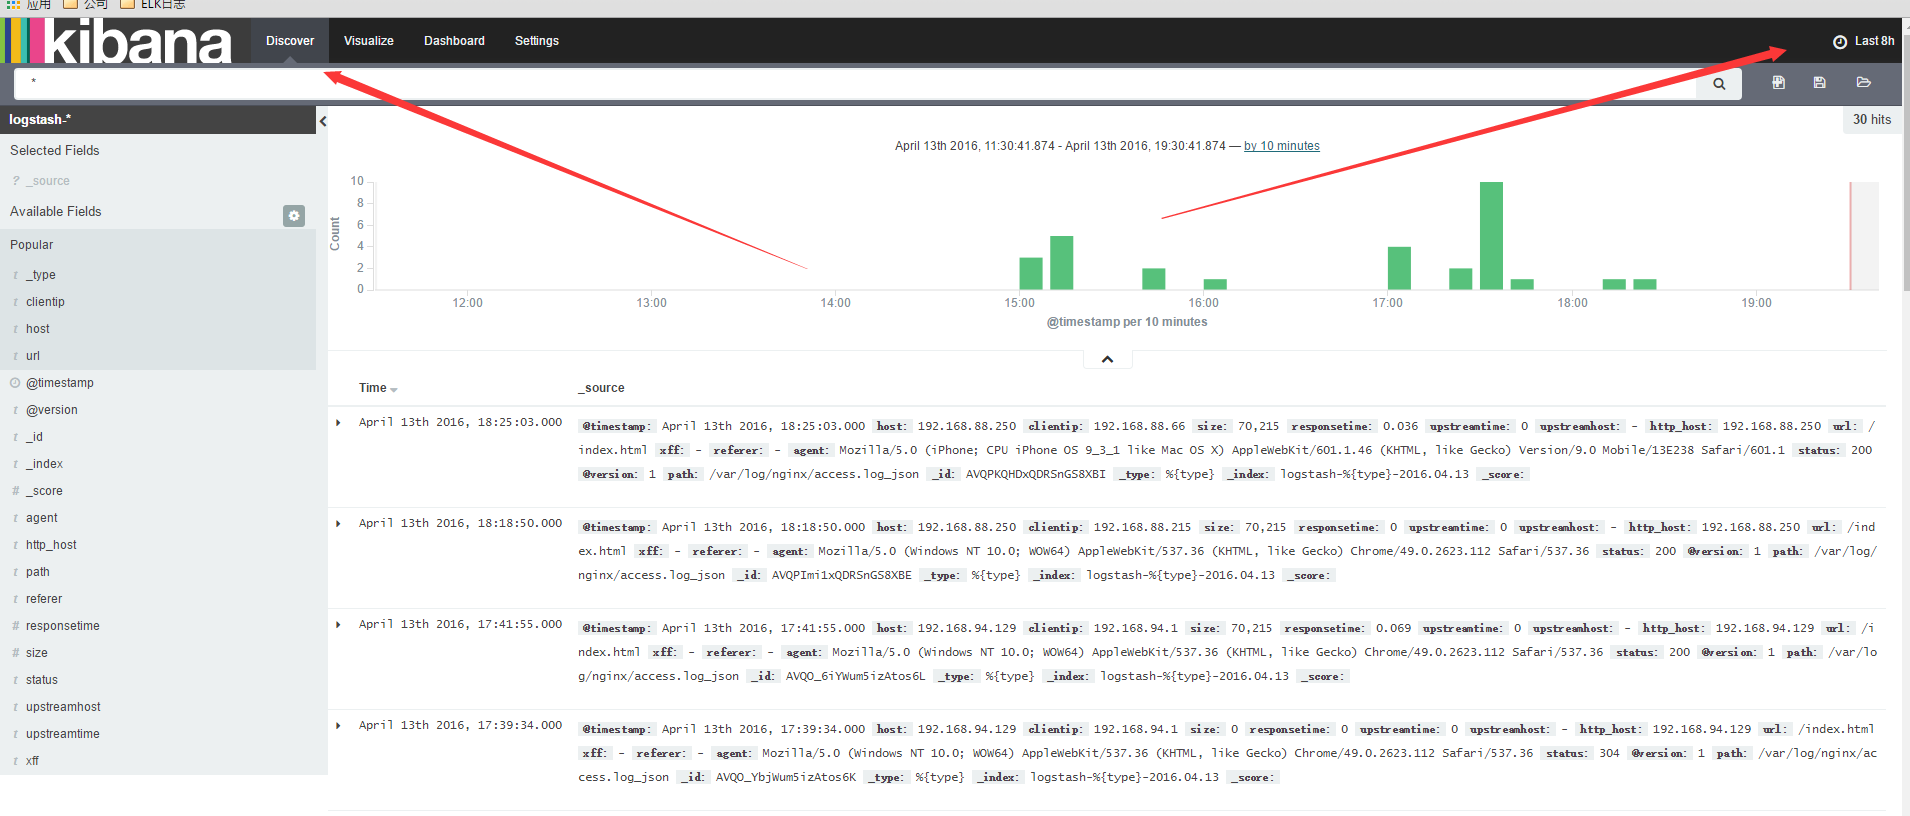
数据可能会出不来 那是因为 Kibana 是根据时间来匹配的 并且 因为 Logstash的采集时间使用的UTC 永远早8个小时
所以设置时间 要设置晚8个小时以后
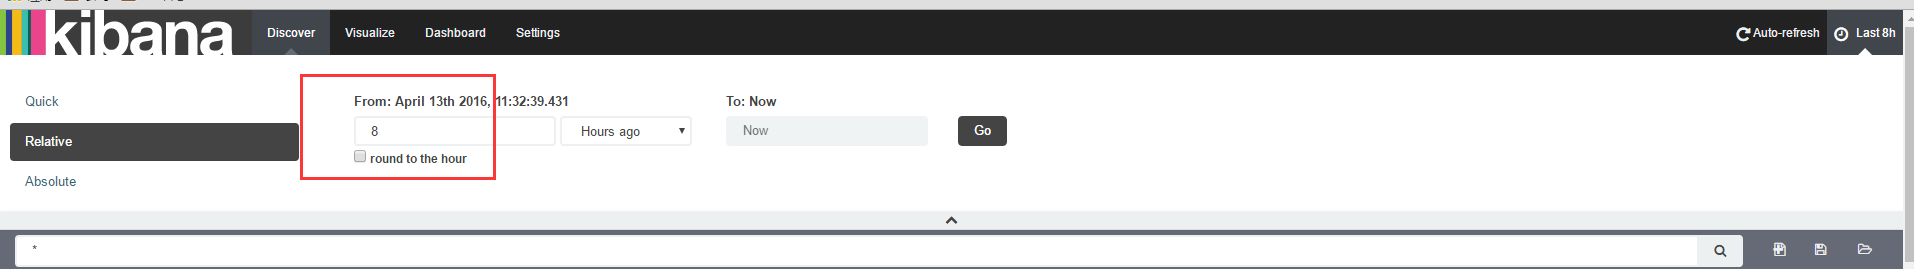
设置好了时间以后 。数据基本就会看的到
这里可以设置你想看到的任意 数据 选择 add 就能看到的 不想看 可以remove
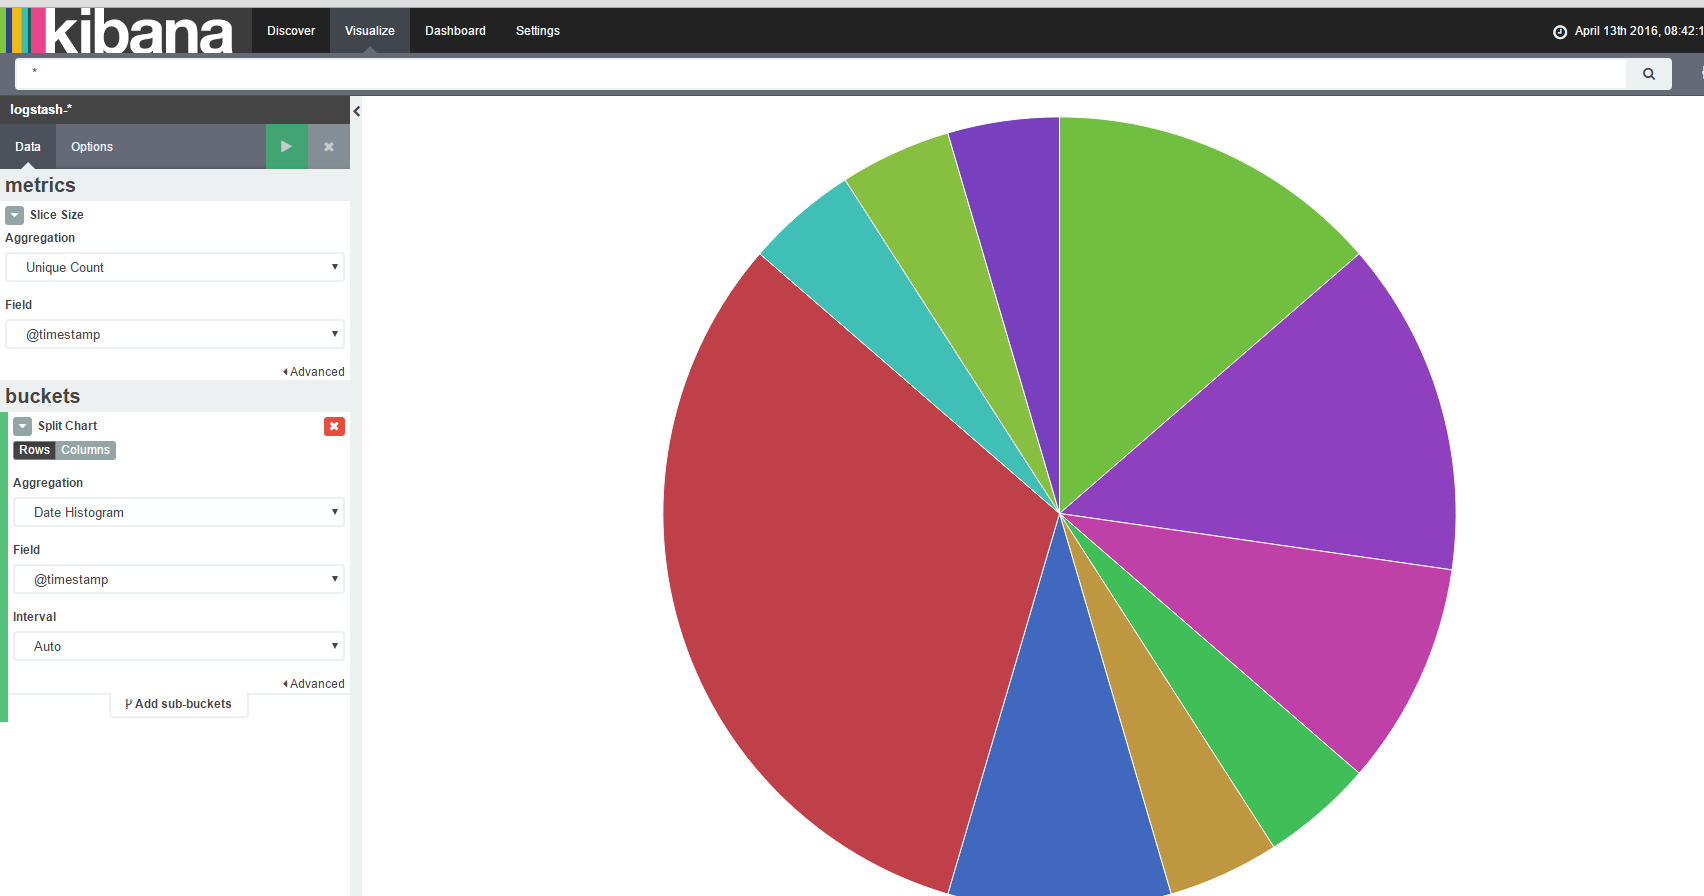
还有后面的 Visualize 也可以个性化定制图标
基本就到此结束了,另外如果 Kibana出不来数据 一般都是因为时间设置不正确。
发布者:全栈程序员-站长,转载请注明出处:https://javaforall.net/207003.html原文链接:https://javaforall.net


