
欢迎关注WX公众号:【程序员管小亮】
plt.annotate()函数用于标注文字。
plt.annotate(s='str', xy=(x,y) , xytext=(l1,l2) , ... ) 参数:
- s 为注释文本内容
- xy 为被注释的坐标点
- xytext 为注释文字的坐标位置
- xycoords 参数如下:
- figure points:图左下角的点
- figure pixels:图左下角的像素
- figure fraction:图的左下部分
- axes points:坐标轴左下角的点
- axes pixels:坐标轴左下角的像素
- axes fraction:左下轴的分数
- data:使用被注释对象的坐标系统(默认)
- polar(theta,r):if not native ‘data’ coordinates t
- weight 设置字体线型
- {‘ultralight’, ‘light’, ‘normal’, ‘regular’, ‘book’, ‘medium’, ‘roman’, ‘semibold’, ‘demibold’, ‘demi’, ‘bold’, ‘heavy’, ‘extra bold’, ‘black’}
- color 设置字体颜色
- {‘b’, ‘g’, ‘r’, ‘c’, ‘m’, ‘y’, ‘k’, ‘w’}
- ‘black’,’red’等
- [0,1]之间的浮点型数据
- RGB或者RGBA, 如: (0.1, 0.2, 0.5)、(0.1, 0.2, 0.5, 0.3)等
- arrowprops #箭头参数,参数类型为字典dict
- width:箭头的宽度(以点为单位)
- headwidth:箭头底部以点为单位的宽度
- headlength:箭头的长度(以点为单位)
- shrink:总长度的一部分,从两端“收缩”
- facecolor:箭头颜色
- bbox给标题增加外框 ,常用参数如下:
- boxstyle:方框外形
- facecolor:(简写fc)背景颜色
- edgecolor:(简写ec)边框线条颜色
- edgewidth:边框线条大小
例子1:
import matplotlib.pyplot as plt import numpy as np x = np.arange(0, 6) y = x * x plt.plot(x, y, marker='o') for xy in zip(x, y): plt.annotate("(%s,%s)" % xy, xy=xy, xytext=(-20, 10), textcoords='offset points') plt.show() 

例子2:
把weight参数改成heavy。
import matplotlib.pyplot as plt import numpy as np x = np.arange(0, 6) y = x * x plt.plot(x, y, marker='o') for xy in zip(x, y): plt.annotate("(%s,%s)" % xy, xy=xy, xytext=(-20, 10), textcoords='offset points', weight='heavy') plt.show() 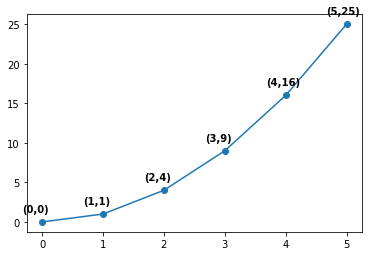
例子3:
把color参数改成y。
import matplotlib.pyplot as plt import numpy as np x = np.arange(0, 6) y = x * x plt.plot(x, y, marker='o') for xy in zip(x, y): plt.annotate("(%s,%s)" % xy, xy=xy, xytext=(-20, 10), textcoords='offset points', color='y') plt.show() 
例子4:
把arrowprops参数改成通过dict传入参数(facecolor = “r”, headlength = 10, headwidth = 30, width = 20)。
import matplotlib.pyplot as plt import numpy as np x = np.arange(0, 6) y = x * x plt.plot(x, y, marker='o') for xy in zip(x, y): plt.annotate("(%s,%s)" % xy, xy=xy, xytext=(-20, 10), textcoords='offset points', arrowprops = dict(facecolor = "r", headlength = 10, headwidth = 30, width = 20)) plt.show() 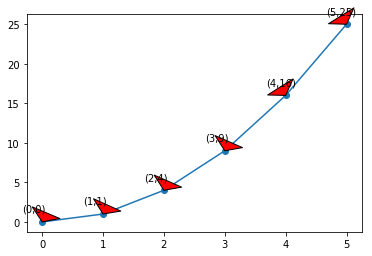
例子5:
把bbox参数改成通过dict传入参数(boxstyle=‘round,pad=0.5’, fc=‘yellow’, ec=‘k’,lw=1 ,alpha=0.5)。
import matplotlib.pyplot as plt import numpy as np x = np.arange(0, 6) y = x * x plt.plot(x, y, marker='o') for xy in zip(x, y): plt.annotate("(%s,%s)" % xy, xy=xy, xytext=(-20, 10), textcoords='offset points', bbox=dict(boxstyle='round,pad=0.5', fc='yellow', ec='k', lw=1, alpha=0.5) plt.show() 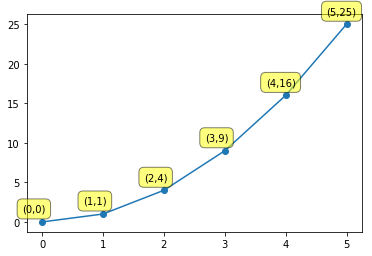
例子6:
把arrowprops参数改成通过dict传入参数(facecolor=‘black’, shrink=0.05)。
import matplotlib.pyplot as plt import numpy as np x = np.arange(0, 6) y = x * x plt.plot(x, y, marker='o') for xy in zip(x, y): plt.annotate('local max', xy=(2, 1), xytext=(3, 1.5), arrowprops=dict(facecolor='black', shrink=0.05)) plt.show() 
版权声明:本文内容由互联网用户自发贡献,该文观点仅代表作者本人。本站仅提供信息存储空间服务,不拥有所有权,不承担相关法律责任。如发现本站有涉嫌侵权/违法违规的内容, 请联系我们举报,一经查实,本站将立刻删除。
发布者:全栈程序员-站长,转载请注明出处:https://javaforall.net/224746.html原文链接:https://javaforall.net


