
目录
代码里script.src = ‘./static/echarts.min.js’ (更改路径不行的话,还是建议使用此路径) 在【4里面】
4.echarts.min.js 代码 (下载如果C币不够可以私信或者留言我给调整下【本来是不要C币的系统自动加币俺也没办法】)
demo下载地址 (下载如果C币不够可以私信或者留言我给调整下)

(不支持小程序【支持app和H5】)
1.首先在uni-app中不支持包下载所以得自己先新建一个项目,然后进入到这个目录下,执行 npm init,接下来一路回车即可。
2.下载所需要的库
npm install echarts mpvue-echarts --save 3.引用(5是页面代码)
import echarts from '@/components/echarts/echarts.vue';下面的是 echarts.vue的代码 您可以在components 创建一个echarts的文件夹里面放echarts.vue
代码里script.src = ‘./static/echarts.min.js’ (更改路径不行的话,还是建议使用此路径) 在【4里面】
<template> <view> <view class="echarts" :prop="option" :change:prop="echarts.update"></view> </view> </template> <script> export default { name: 'Echarts', props: { option: { type: Object, required: true } } } </script> <script module="echarts" lang="renderjs"> export default { data() { return { chart: null } }, mounted() { if (typeof window.echarts === 'object') { this.init() } else { // 动态引入类库 const script = document.createElement('script') script.src = './static/echarts.min.js' // script.src = './static/echarts/echarts.min.js' script.onload = this.init document.head.appendChild(script) } }, methods: { / * 初始化echarts */ init() { this.chart = echarts.init(this.$el) this.update(this.option) }, / * 监测数据更新 * @param {Object} option */ update(option) { if (this.chart) { // 因App端,回调函数无法从renderjs外传递,故在此自定义设置相关回调函数 if (option) { // tooltip if (option.tooltip) { // 判断是否设置tooltip的位置 if (option.tooltip.positionStatus) { option.tooltip.position = this.tooltipPosition() } // 判断是否格式化tooltip if (option.tooltip.formatterStatus) { option.tooltip.formatter = this.tooltipFormatter(option.tooltip.formatterUnit, option.tooltip.formatFloat2, option.tooltip.formatThousands) } } // 设置新的option this.chart.setOption(option, option.notMerge) } } }, / * 设置tooltip的位置,防止超出画布 */ tooltipPosition() { return (point, params, dom, rect, size) => { //其中point为当前鼠标的位置,size中有两个属性:viewSize和contentSize,分别为外层div和tooltip提示框的大小 let x = point[0] let y = point[1] let viewWidth = size.viewSize[0] let viewHeight = size.viewSize[1] let boxWidth = size.contentSize[0] let boxHeight = size.contentSize[1] let posX = 0 //x坐标位置 let posY = 0 //y坐标位置 if (x < boxWidth) { //左边放不开 posX = 5 } else { //左边放的下 posX = x - boxWidth } if (y < boxHeight) { //上边放不开 posY = 5 } else { //上边放得下 posY = y - boxHeight } return [posX, posY] } }, / * tooltip格式化 * @param {Object} unit 数值后的单位 * @param {Object} formatFloat2 是否保留两位小数 * @param {Object} formatThousands 是否添加千分位 */ tooltipFormatter(unit, formatFloat2, formatThousands) { return params => { let result = '' unit = unit ? unit : '' for (let i in params) { if (i == 0) { result += params[i].axisValueLabel } let value = '--' if (params[i].data !== null) { value = params[i].data // 保留两位小数 if (formatFloat2) { value = this.formatFloat2(value) } // 添加千分位 if (formatThousands) { value = this.formatThousands(value) } } // #ifdef H5 result += '\n' + params[i].seriesName + ':' + value + ' ' + unit // #endif // #ifdef APP-PLUS result += '<br/>' + params[i].marker + params[i].seriesName + ':' + value + ' ' + unit // #endif } return result } }, / * 保留两位小数 * @param {Object} value */ formatFloat2(value) { let temp = Math.round(parseFloat(value) * 100) / 100 let xsd = temp.toString().split('.') if (xsd.length === 1) { temp = (isNaN(temp) ? '0' : temp.toString()) + '.00' return temp } if (xsd.length > 1) { if (xsd[1].length < 2) { temp = temp.toString() + '0' } return temp } }, / * 添加千分位 * @param {Object} value */ formatThousands(value) { if (value === undefined || value === null) { value = '' } if (!isNaN(value)) { value = value + '' } let re = /\d{1,3}(?=(\d{3})+$)/g let n1 = value.replace(/^(\d+)((\.\d+)?)$/, function(s, s1, s2) { return s1.replace(re, '$&,') + s2 }) return n1 } } } </script> <style lang="scss" scoped> .echarts { width: 100%; height: 100%; } </style>4.echarts.min.js 代码 (下载如果C币不够可以私信) 建议放到static里面
下面这是在gitee上面的自行下载
梦寻汝/uni-app引用echarts.min
echarts.min.js_uniappecharts-其它文档类资源-CSDN下载
5.随便起一个Vue页面 复制下面代码
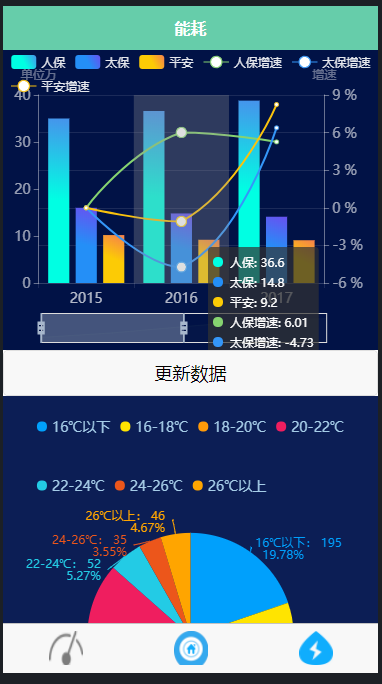
<template> <view class="viewimg"> <view> <view>echarts示列</view> <echarts :option="option" style="height: 300px;"></echarts> <button @click="updateClick">更新数据</button> </view> <view><echarts :option="optionone" style="height: 400px;"></echarts></view> <view><echarts :option="optiontwo" style="height: 400px;"></echarts></view> </view> </template> <script> import echarts from '@/components/echarts/echarts.vue'; export default { data() { return { option: {}, optionone:{}, optiontwo:{} }; }, onLoad() { console.log(); }, components: { echarts }, mounted() { this.logstatrt(); this.logstatrtone(); this.logstatrttwo(); }, methods: { logstatrt() { console.log('初次调用'); this.option = { backgroundColor: '#011246', tooltip: { trigger: 'axis', axisPointer: { type: 'shadow' } }, grid: { top: '25%', right: '45', bottom: '20', left: '30' }, legend: { data: [{ name: '人保' }, { name: '太保' }, { name: '平安' }, { name: '人保增速' }, { name: '太保增速' }, { name: '平安增速' }], top: '0%', textStyle: { color: 'rgba(255,255,255,0.9)' //图例文字 } }, dataZoom: [ { type: 'slider', realtime: true, //移动端展示方式 handleSize: '100%', //滑动条两侧的大小 start: 0, end: 50 } ], grid: { left: '3%', right: '4%', bottom: '15%', height: '70%', containLabel: true }, xAxis: [ { type: 'category', data: ['2015', '2016', '2017', '2018', '2019'], axisLine: { lineStyle: { color: 'rgba(255,255,255,.1)' } }, axisLabel: { textStyle: { color: 'rgba(255,255,255,.7)', fontSize: '14' } } } ], yAxis: [ { type: 'value', name: '单位万', splitLine: { show: false }, axisLabel: { show: true, fontSize: 14, color: 'rgba(255,255,255,.6)' }, axisLine: { min: 0, max: 10, lineStyle: { color: 'rgba(255,255,255,.4)' } } //左线色 }, { type: 'value', name: '增速', show: true, axisLabel: { show: true, fontSize: 14, formatter: '{value} %', color: 'rgba(255,255,255,.6)' }, axisLine: { lineStyle: { color: 'rgba(255,255,255,.4)' } }, //右线色 splitLine: { show: true, lineStyle: { color: 'rgba(255,255,255,.1)' } } //x轴线 } ], series: [ { name: '人保', type: 'bar', data: [35, 36.6, 38.8, 40.84, 41.6], // "barWidth": "30", itemStyle: { normal: { color: { type: 'linear', x: 0.5, y: 0.5, r: 0.5, colorStops: [ { offset: 0, color: '#00FFE3' // 0% 处的颜色 }, { offset: 1, color: '#4693EC' // 100% 处的颜色 } ], globalCoord: false // 缺省为 false } } } // "barGap": "0.2" }, { name: '太保', type: 'bar', data: [16, 14.8, 14.1, 15, 16.3], color: { type: 'linear', x: 0.5, y: 0.5, r: 0.5, colorStops: [ { offset: 0, color: '#248ff7' // 0% 处的颜色 }, { offset: 1, color: '#6851f1' // 100% 处的颜色 } ], globalCoord: false // 缺省为 false } }, { name: '平安', type: 'bar', data: [10.2, 9.2, 9.1, 9.85, 8.9], color: { type: 'linear', x: 0.5, y: 0.5, r: 0.5, colorStops: [ { offset: 0, color: '#fccb05' // 0% 处的颜色 }, { offset: 1, color: '#f5804d' // 100% 处的颜色 } ], globalCoord: false // 缺省为 false } }, { name: '人保增速', type: 'line', yAxisIndex: 1, data: [0, 6.01, 5.26, 1.48], lineStyle: { normal: { width: 2 } }, itemStyle: { normal: { color: '#86d370' } }, smooth: true }, { name: '太保增速', type: 'line', yAxisIndex: 1, data: [0, -4.73, 6.38, 8.67], lineStyle: { normal: { width: 2 } }, itemStyle: { normal: { color: '#3496f8' } }, smooth: true }, { name: '平安增速', type: 'line', yAxisIndex: 1, data: [0, -1.09, 8.24, -9.64], lineStyle: { normal: { width: 2 } }, itemStyle: { normal: { color: '#fbc30d' } }, smooth: true } ] }; }, logstatrtone(){ this.optionone = { backgroundColor: '#0c1e55', color: ['#00a0fc', '#ffe400', '#ff9a09', '#ef1e5f','#23cbe5', '#ec561b', '#ffa500', '#dddf00', '#b23aee', '#50b332'], tooltip: { trigger: 'item', // formatter: " {a} <br/>{b} : {c} ({d}%)" formatter: " 企业数:{c}" }, legend: { // 图例-图上面的分类 // orient: 'vertical', // right: 30, // icon: 'rect',//长方形 icon: 'circle', top: "1%", itemWidth: 10, itemHeight: 10, // itemGap: 13, data: ['16℃以下', '16-18℃', '18-20℃', '20-22℃','22-24℃','24-26℃','26℃以上' ], // right: '56%', textStyle: { fontSize: 14, color: '#a6cde8', lineHeight: 49 }, formatter: function(name) { return "" + name + "" }, padding: [2, 2] }, grid: { top: '20%', left: '53%', right: '10%', bottom: '6%', containLabel: true }, series: [{ label: { normal: { formatter: '{b|{b}:} {c} \n {per|{d}%} ', rich: { } }, emphasis: { show: true, } }, // labelLine: { // normal: { // show: false // } // }, name: '访问来源', type: 'pie', radius: '55%', center: ['50%', '60%'], data:[{ value: 195, name: '16℃以下' }, { value: 185, name: '16-18℃' }, { value: 260, name: '18-20℃' }, { value: 213, name: '20-22℃' }, { value: 52, name: '22-24℃' }, { value: 35, name: '24-26℃' }, { value: 46, name: '26℃以上' }, ], itemStyle: { emphasis: { shadowBlur: 10, shadowOffsetX: 0, shadowColor: 'rgba(0, 0, 0, 0.5)' } }, labelLine: { normal: { length: 5, length2: 1, smooth: true, } }, }] }; }, logstatrttwo(){ var m2R2Data = [{ value: 335, value1: 234, legendname: 'Ⅰ类', name: "Ⅰ类", itemStyle: { color: "#8d7fec" } }, { value: 310, value1: 314, legendname: 'Ⅱ类', name: "Ⅱ类", itemStyle: { color: "#5085f2" } }, { value: 234, value1: 235, legendname: 'Ⅲ类', name: "Ⅲ类", itemStyle: { color: "#e75fc3" } }, { value: 154, value1: 213, legendname: 'Ⅳ类', name: "Ⅳ类", itemStyle: { color: "#f87be2" } }, { value: 335, value1: 321, legendname: 'Ⅴ类', name: "Ⅴ类", itemStyle: { color: "#f2719a" } }, ]; this.optiontwo = { title: [{ text: '全网调控情况', textStyle: { fontSize: 16, color: "black" }, left: "35%" }, { text: '全网均温', subtext: 44.5 + '℃', textStyle: { fontSize: 15, color: "black" }, subtextStyle: { fontSize: 20, color: 'black' }, textAlign: "center", x: '40%', y: '44%', } ], tooltip: { trigger: 'item', formatter: function(parms) { var str = parms.seriesName + "</br>" + parms.marker + "" + parms.data.legendname + "</br>" + "当前温度:" + parms.data.value + "</br>" + "目标温度:" + parms.data.value1 + "</br>" + "占比:" + parms.percent + "%"; return str; } }, legend: { type: "scroll", orient: 'vertical', left: '80%', align: 'left', top: 'middle', textStyle: { color: '#8C8C8C' }, }, series: [{ name: '全网调控情况', type: 'pie', center: ['40%', '50%'], radius: ['40%', '65%'], clockwise: false, //饼图的扇区是否是顺时针排布 avoidLabelOverlap: false, itemStyle: { //图形样式 normal: { borderColor: '#ffffff', borderWidth: 1, }, }, label: { normal: { show: true, position: 'outter', formatter: function(parms) { return parms.data.legendname } } }, labelLine: { normal: { length: 15, length2: 13, smooth: true, } }, data: m2R2Data }] }; }, / * 更新数据 */ updateClick() { this.option = { notMerge: true, // 自定义变量:true代表不合并数据,比如从折线图变为柱形图则需设置为true;false或不写代表合并 xAxis: { type: 'category', data: ['Mon', 'Tue', 'Wed', 'Thu', 'Fri', 'Sat', 'Sun'] }, yAxis: { type: 'value' }, series: [ { data: [120, 200, 150, 80, 70, 110, 130], type: 'bar', showBackground: true, backgroundStyle: { color: 'rgba(220, 220, 220, 0.8)' } } ] }; } } }; </script> <style> .viewimg { height: 100%; /* background: #d1e9e9; */ } </style> demo下载地址 (下载如果C币不够可以私信或者留言我给demo)
uni-app引用echarts-Demo.rar_echartsuniapp,uni-app引入echarts-其它文档类资源-CSDN下载
若按照文档仍没有弄出来加: 加的时候备注下
如有帮助请点个赞呗
放到子组件里面可以 但是 页面要是有很多的echarts的话 建议 在传点击参数判断下(子组件加点击事件我这么没有测试成功)
版权声明:本文内容由互联网用户自发贡献,该文观点仅代表作者本人。本站仅提供信息存储空间服务,不拥有所有权,不承担相关法律责任。如发现本站有涉嫌侵权/违法违规的内容, 请联系我们举报,一经查实,本站将立刻删除。
发布者:全栈程序员-站长,转载请注明出处:https://javaforall.net/231748.html原文链接:https://javaforall.net


