
springboot 应用配置
Gradle
//        monitoring
implementation 'org.springframework.boot:spring-boot-starter-actuator:2.3.4.RELEASE'
compile 'io.micrometer:micrometer-registry-prometheus'
compile 'io.micrometer:micrometer-core'
Maven
      	<dependency>
            <groupId>org.springframework.boot</groupId>
            <artifactId>spring-boot-starter-actuator</artifactId>
        </dependency>
        <dependency>
            <groupId>io.micrometer</groupId>
            <artifactId>micrometer-core</artifactId>
        </dependency>
        <dependency>
            <groupId>io.micrometer</groupId>
            <artifactId>micrometer-registry-prometheus</artifactId>
        </dependency>
在application.yml里
#monitoring
management:
  endpoint:
    metrics:
      enabled: true
    #启用prometheus
    prometheus:
      enabled: true
  endpoints:
    web:
      exposure:
      	# '*' 表示所有,也可以指定如:health,info等
        include: '*'
        exclude: env,beans
  metrics:
    export:
      prometheus:
        enabled: true
  #监控中以使用独立的端口
  server:
    port: 8081
运行检查
查看springboot健康指标
http://localhost:8081/actuator/health


up正常,down异常
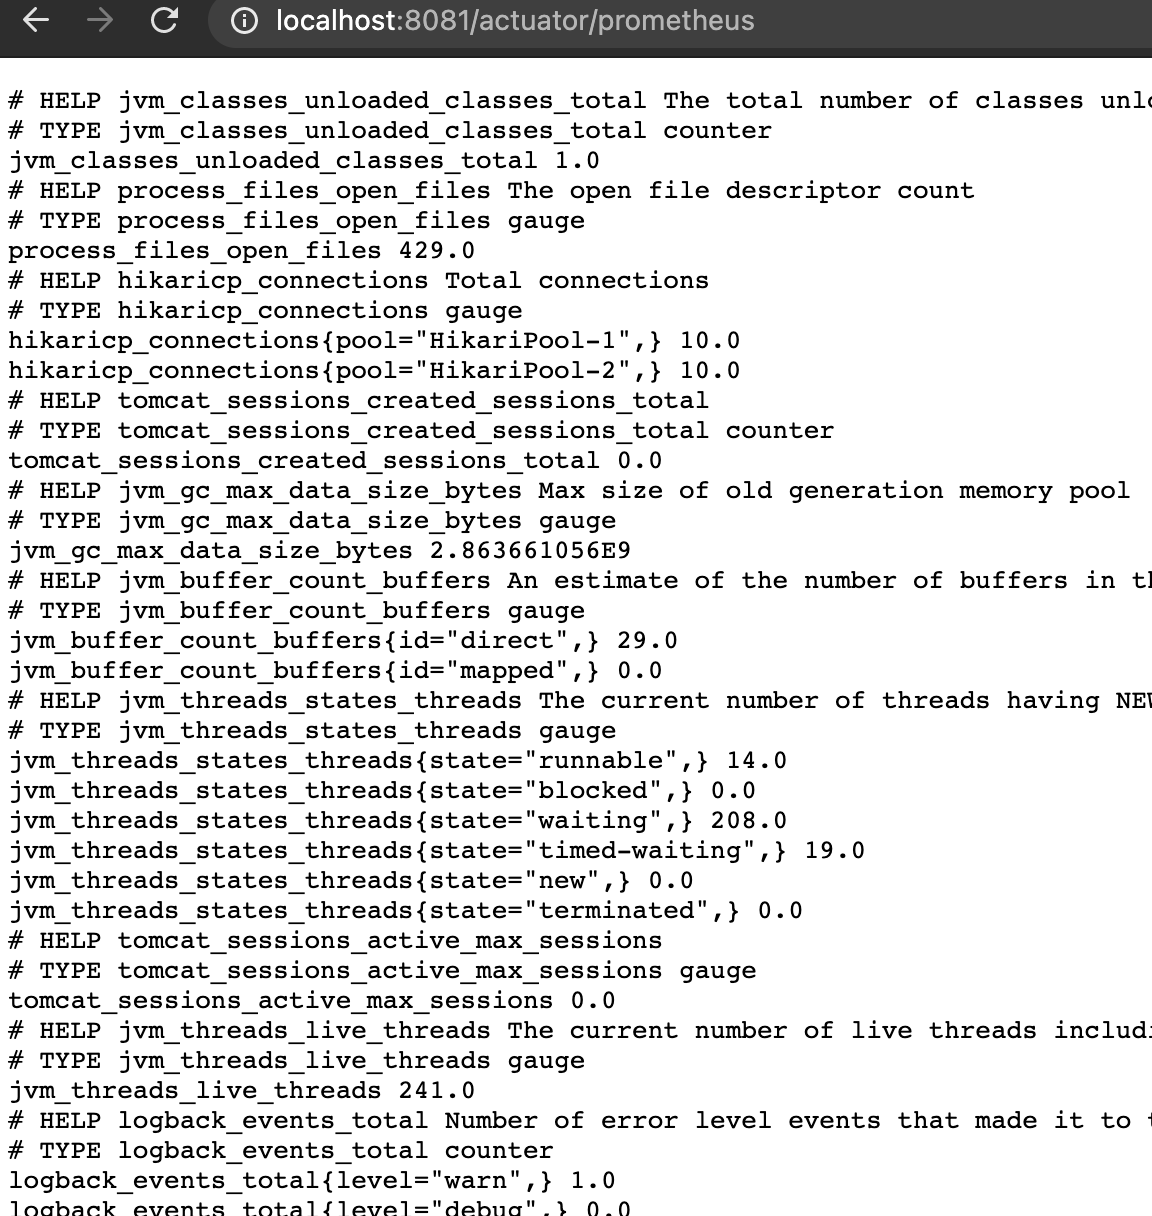
查看prometheus指标
http://localhost:8081/actuator/prometheus
配置prometheus
prometheus的配置文件
prometheus.yml
scrape_configs:
  # 可随意指定
  - job_name: 'spring-boot'
    # 多久采集一次数据
    scrape_interval: 15s
    # 采集时的超时时间
    scrape_timeout: 10s
    # 采集的路径
    metrics_path: '/actuator/prometheus'
    # 采集服务的地址,设置成Springboot应用所在服务器的具体地址
    static_configs:
      - targets: ['192.168.100.12:8081']
其中192.168.100.12为本机的ip,注意使用docker运行时,ip不要使用localhost,docker的网卡是独立的。
使用docker运行prometheus
docker run -d -p 9090:9090 -v ~/spring-boot-on-kubernetes/docker/prometheus.yml:/etc/prometheus/prometheus.yml prom/prometheus --config.file=/etc/prometheus/prometheus.yml
-v 参数,挂载本地~/spring-boot-on-kubernetes/docker/prometheus.yml
grafana配置
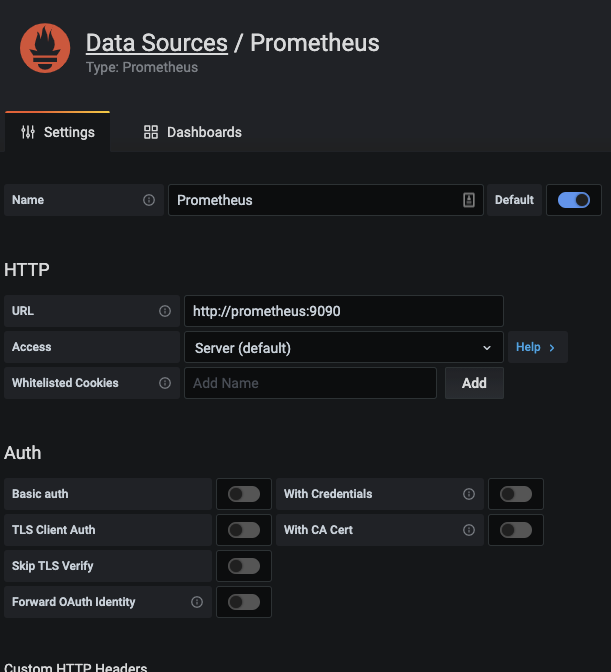
配置prometheus
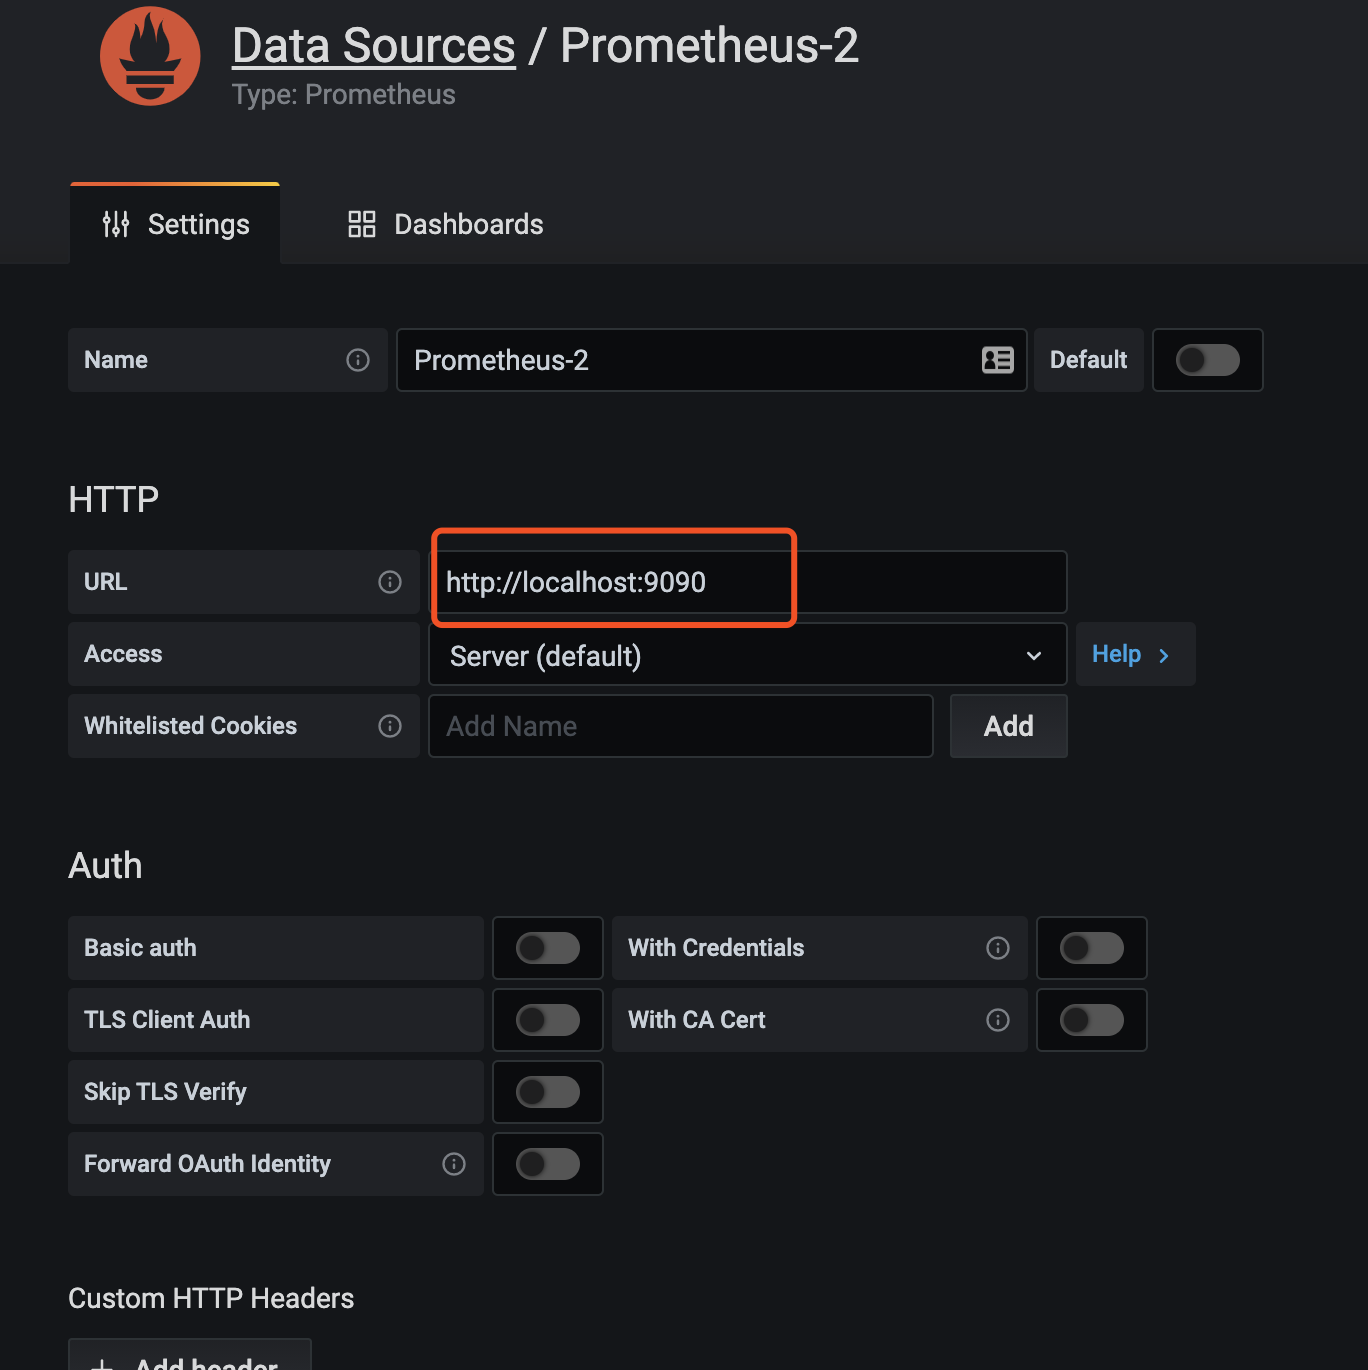
配置模板
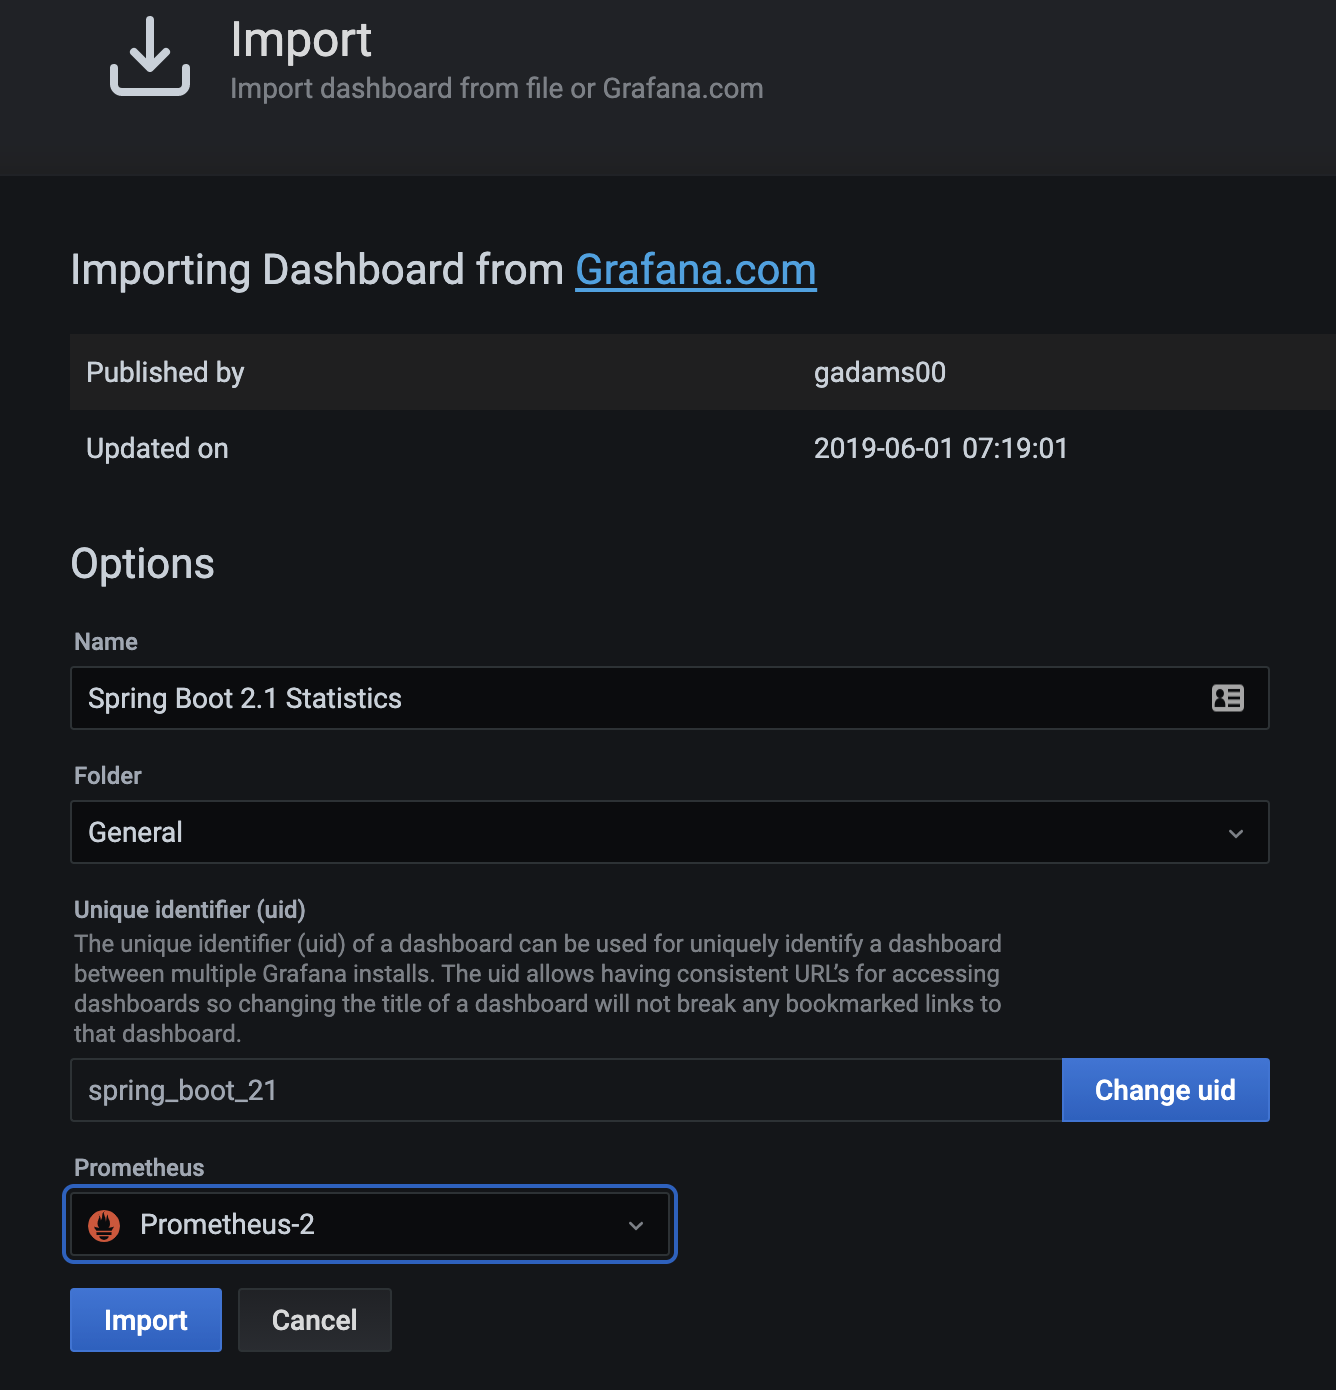
下载grafana模板:https://grafana.com/grafana/dashboards/10280
导入
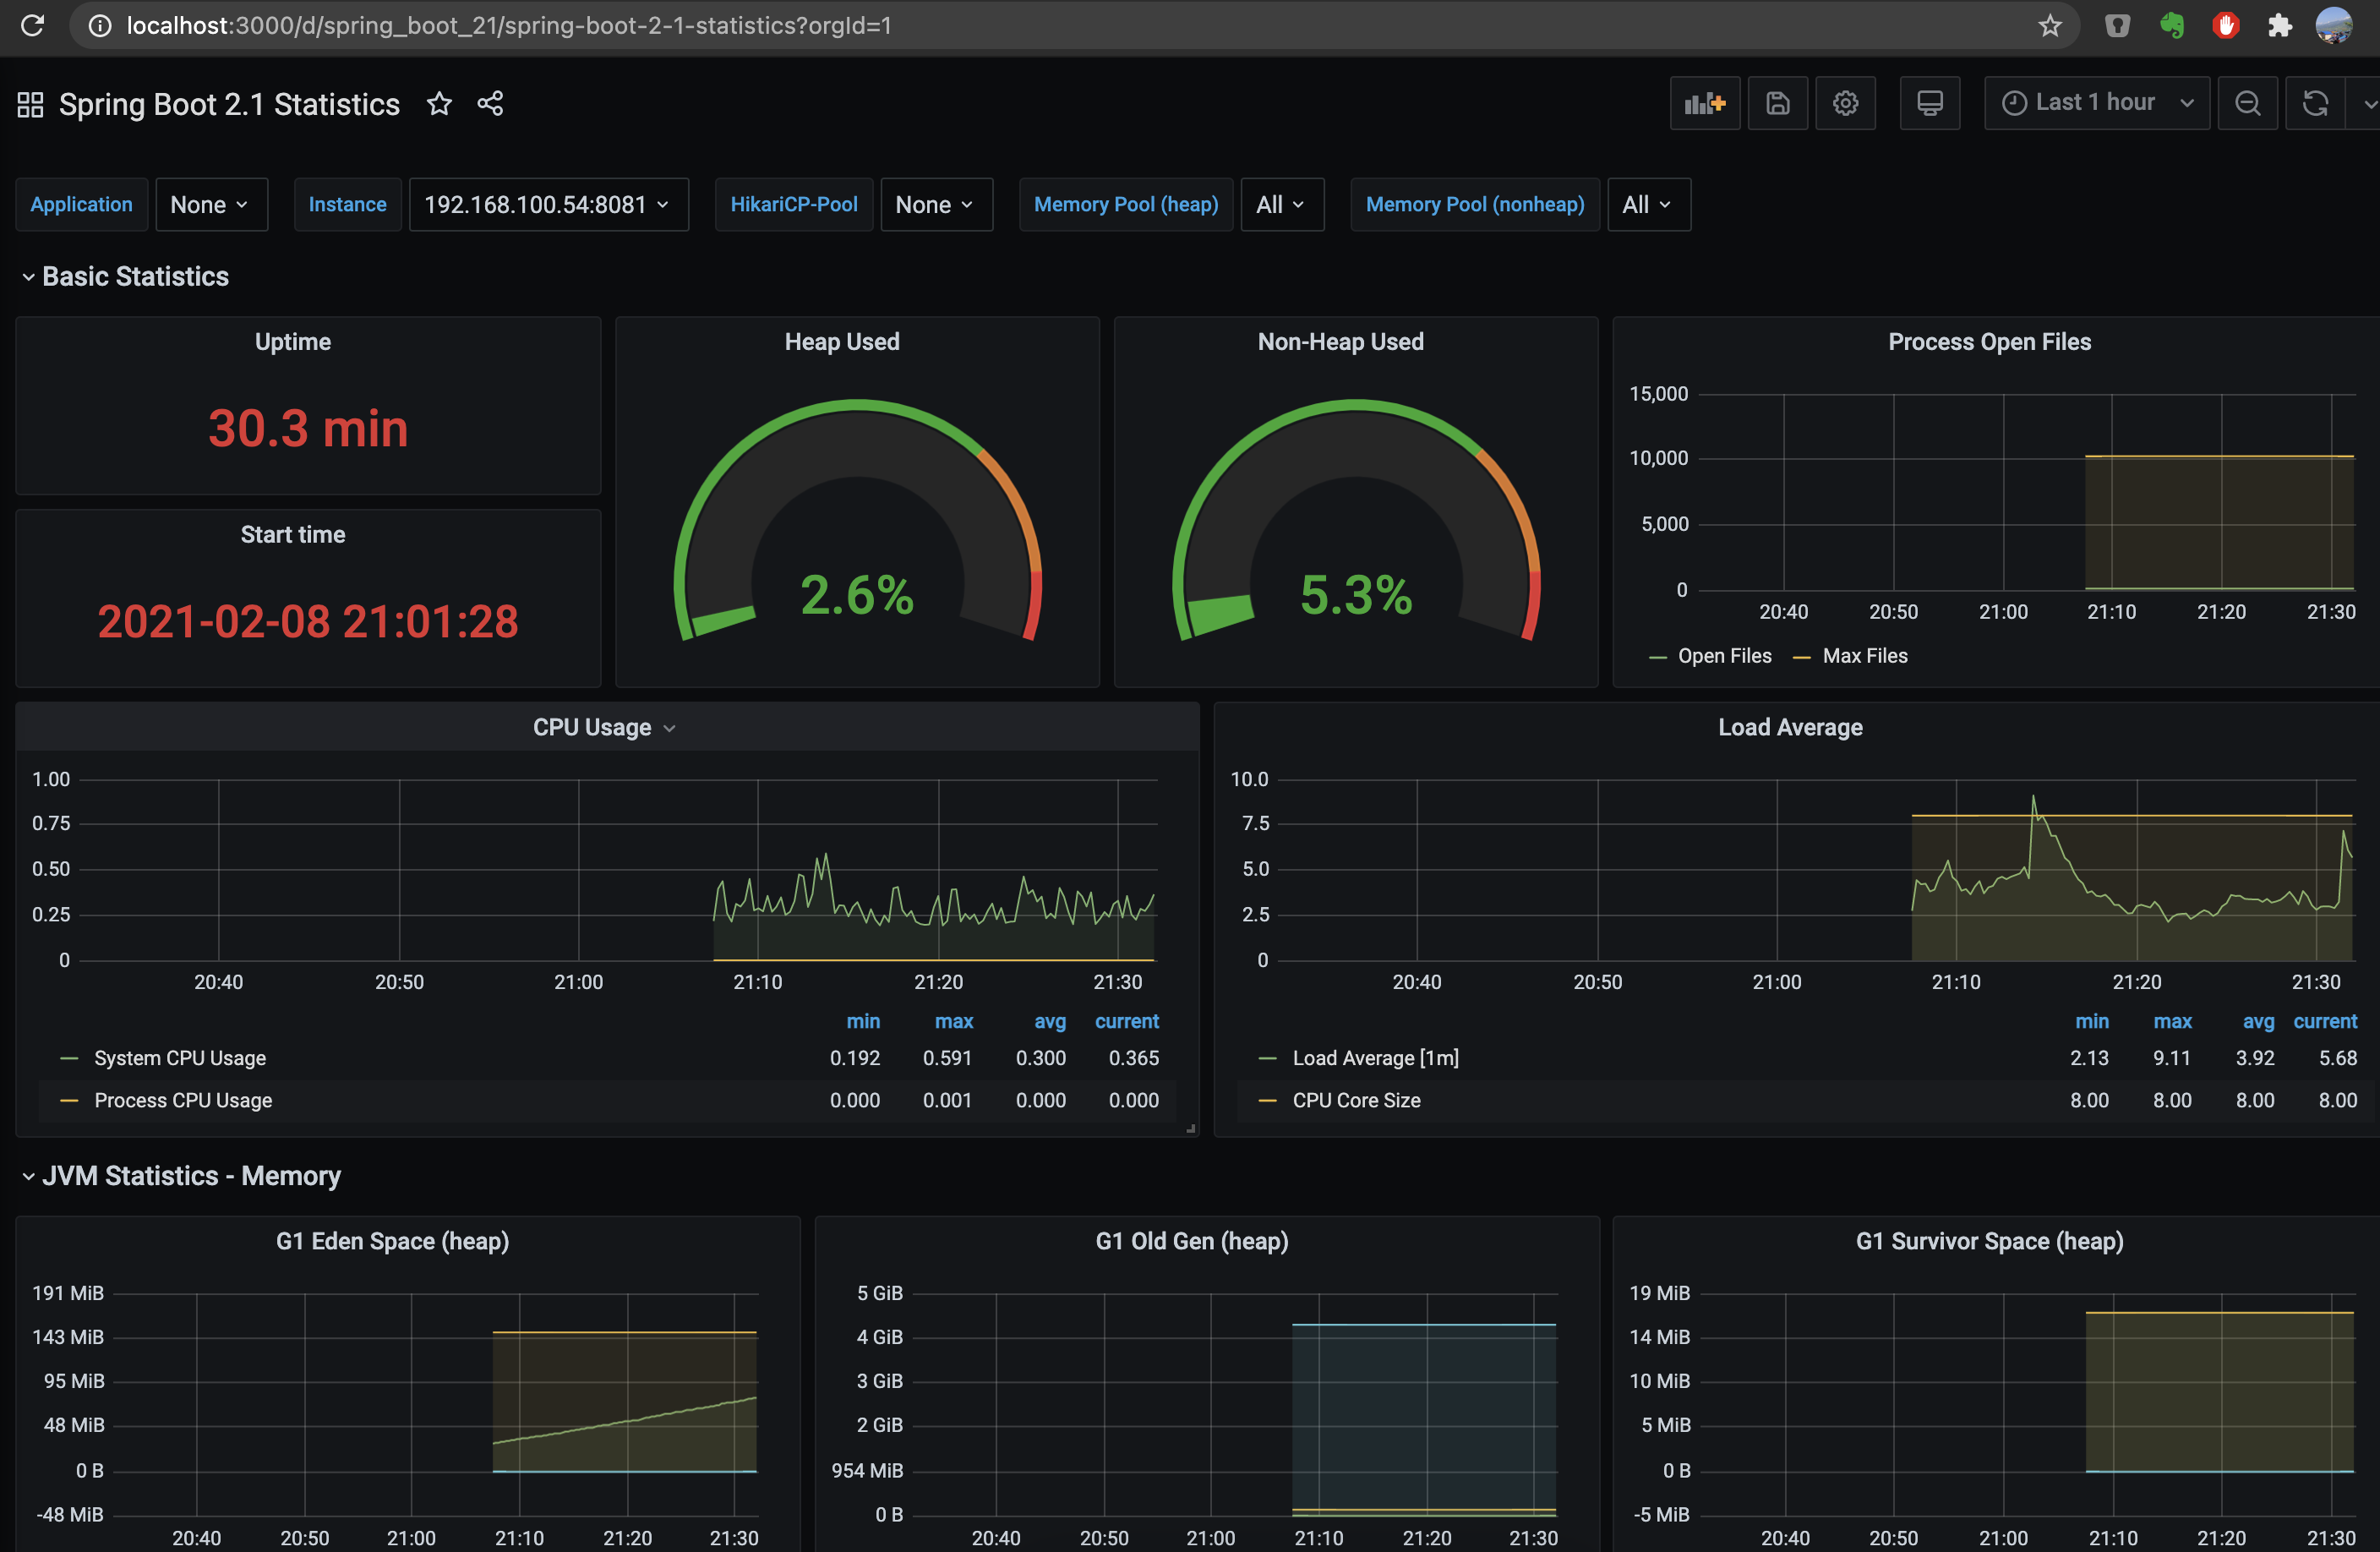
展示
** 使用docker安装 **
docker run -d -p 3001:3000 --link vibrant_meninsky:prometheus grafana/grafana
其中vibrant_meninsky为prometheus 的docker名字
配置prometheus时使用
http://prometheus:9090
参考
https://docs.spring.io/spring-boot/docs/current/reference/html/production-ready-features.html#production-ready-enabling
版权声明:本文内容由互联网用户自发贡献,该文观点仅代表作者本人。本站仅提供信息存储空间服务,不拥有所有权,不承担相关法律责任。如发现本站有涉嫌侵权/违法违规的内容, 请发送邮件至 举报,一经查实,本站将立刻删除。
发布者:全栈程序员-站长,转载请注明出处:https://javaforall.net/100336.html原文链接:https://javaforall.net