
大家好,又见面了,我是你们的朋友全栈君。
SciPy的interpolate模块提供了许多对数据进行插值运算的函数,范围涵盖简单的一维插值到复杂多维插值求解。当样本数据变化归因于一个独立的变量时,就使用一维插值;反之样本数据归因于多个独立变量时,使用多维插值。
class scipy.interpolate.interp1d(x, y, kind=’linear’, axis=-1, copy=True, bounds_error=None, fill_value=nan, assume_sorted=False)[source]
Interpolate a 1-D function.
x and y are arrays of values used to approximate some function f: y = f(x). This class returns a function whose call method uses interpolation to find the value of new points.x和y是用来逼近函数f: y = f(x)的值的数组。该类返回一个函数,该函数的调用方法使用插值表达式来查找新点的值。
Note that calling interp1d with NaNs present in input values results in undefined behaviour.注意,使用在输入值中出现的NaNs调用interp1d会导致未定义的行为。
Parameters
x(N,) array_like
A 1-D array of real values.实值的一维数组。
y(…,N,…) array_like
A N-D array of real values. The length of y along the interpolation axis must be equal to the length of x.实值的N-D数组。沿插补轴的y的长度必须等于x的长度。
kind str or int, optional
Specifies the kind of interpolation as a string (‘linear’, ‘nearest’, ‘zero’, ‘slinear’, ‘quadratic’, ‘cubic’, ‘previous’, ‘next’, where ‘zero’, ‘slinear’, ‘quadratic’ and ‘cubic’ refer to a spline interpolation of zeroth, first, second or third order; ‘previous’ and ‘next’ simply return the previous or next value of the point) or as an integer specifying the order of the spline interpolator to use. Default is ‘linear’.指定插值类型为一个字符串(‘ linear ‘, ‘ nearest ‘, ‘ zero ‘, ‘ slinear ‘, ‘ second ‘, ‘ cubic ‘, ‘ previous ‘, ‘ next ‘,其中’ zero ‘, ‘ slinear ‘, ‘ second ‘ and ‘ cubic ‘指的是插值为零、一阶、二阶或三阶的样条曲线;’ previous ‘和’ next ‘简单地返回该点的上一个或下一个值),或者作为一个整数指定样条插值器使用的顺序。默认设置是“线性”。
| 候选值 | 作用 |
|---|---|
| ‘zero’ 、’nearest’ | 阶梯插值,相当于0阶B样条曲线 |
| ‘slinear’ 、’linear’ | 线性插值,用一条直线连接所有的取样点,相当于一阶B样条曲线 |
| ‘quadratic’ 、’cubic’ | 二阶和三阶B样条曲线,更高阶的曲线可以直接使用整数值指定 |
axis int, optional
Specifies the axis of y along which to interpolate. Interpolation defaults to the last axis of y.指定要沿其插入的y轴。插值默认是y的最后一个轴。
copy bool, optional
If True, the class makes internal copies of x and y. If False, references to x and y are used. The default is to copy.如果为真,则该类将创建x和y的内部副本。如果为假,则使用对x和y的引用。默认是复制。
bounds_error bool, optional
If True, a ValueError is raised any time interpolation is attempted on a value outside of the range of x (where extrapolation is necessary). If False, out of bounds values are assigned fill_value. By default, an error is raised unless fill_value="extrapolate".如果为真,则在试图对x范围之外的值进行插值时(需要外推的地方)会产生ValueError。如果为假,则为越界值分配fill_value。默认情况下,除非fill_value=”extrapolate”,否则将引发一个错误。
fill_value array-like or (array-like, array_like) or “extrapolate”, optional
-
if a ndarray (or float), this value will be used to fill in for requested points outside of the data range. If not provided, then the default is NaN. The array-like must broadcast properly to the dimensions of the non-interpolation axes.如果是ndarray(或float),则此值将用于填充数据范围之外的请求点。如果没有提供,那么缺省值是NaN。类数组必须正确地传播到非插值轴的维度。
-
If a two-element tuple, then the first element is used as a fill value for
x_new < x[0]and the second element is used forx_new > x[-1]. Anything that is not a 2-element tuple (e.g., list or ndarray, regardless of shape) is taken to be a single array-like argument meant to be used for both bounds asbelow, above = fill_value, fill_value.如果是双元素元组,则第一个元素用作x_new < x[0]的填充值,第二个元素用作forx_new > x[-1]。任何非2元素元组(例如list或ndarray,无论其形状如何)的内容都被视为一个类似数组的参数,用于下面、上面的两个边界= fill_value、fill_value。New in version 0.17.0.
-
If “extrapolate”, then points outside the data range will be extrapolated.如果“外推”,则外推数据范围之外的点。
New in version 0.17.0.
assume_sorted bool, optional
If False, values of x can be in any order and they are sorted first. If True, x has to be an array of monotonically increasing values.如果为假,则x的值可以是任意顺序的,并且可以先排序。如果为真,则x必须是一个值单调递增的数组。
>>> import numpy as np
>>> import matplotlib.pyplot as pl
>>> from scipy.interpolate import interp1d
>>>
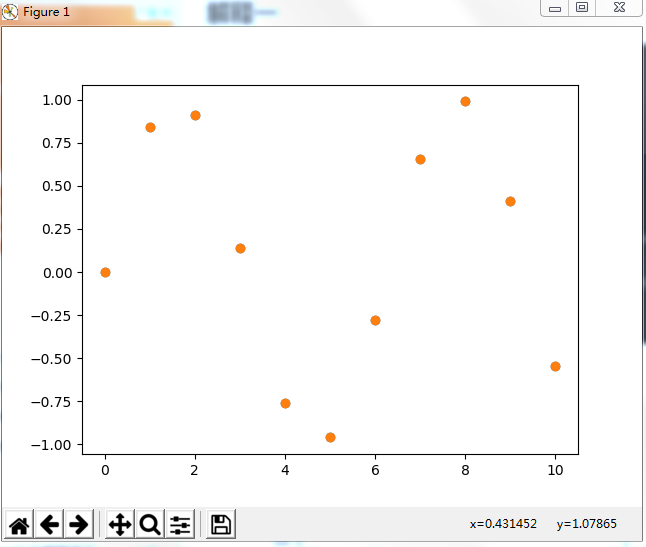
>>> x=np.linspace(0,10,11)
>>> y=np.sin(x)
>>> x
array([ 0., 1., 2., 3., 4., 5., 6., 7., 8., 9., 10.])
>>> y
array([ 0. , 0.84147098, 0.90929743, 0.14112001, -0.7568025 ,
-0.95892427, -0.2794155 , 0.6569866 , 0.98935825, 0.41211849,
-0.54402111])
>>> pl.plot(x,y,"o")
[<matplotlib.lines.Line2D object at 0x000000000AE3BF48>]
>>> pl.show()

>>> x_new = np.linspace(0, 10, 101)
>>> x_new
array([ 0. , 0.1, 0.2, 0.3, 0.4, 0.5, 0.6, 0.7, 0.8, 0.9, 1. ,
1.1, 1.2, 1.3, 1.4, 1.5, 1.6, 1.7, 1.8, 1.9, 2. , 2.1,
2.2, 2.3, 2.4, 2.5, 2.6, 2.7, 2.8, 2.9, 3. , 3.1, 3.2,
3.3, 3.4, 3.5, 3.6, 3.7, 3.8, 3.9, 4. , 4.1, 4.2, 4.3,
4.4, 4.5, 4.6, 4.7, 4.8, 4.9, 5. , 5.1, 5.2, 5.3, 5.4,
5.5, 5.6, 5.7, 5.8, 5.9, 6. , 6.1, 6.2, 6.3, 6.4, 6.5,
6.6, 6.7, 6.8, 6.9, 7. , 7.1, 7.2, 7.3, 7.4, 7.5, 7.6,
7.7, 7.8, 7.9, 8. , 8.1, 8.2, 8.3, 8.4, 8.5, 8.6, 8.7,
8.8, 8.9, 9. , 9.1, 9.2, 9.3, 9.4, 9.5, 9.6, 9.7, 9.8,
9.9, 10. ])
>>>
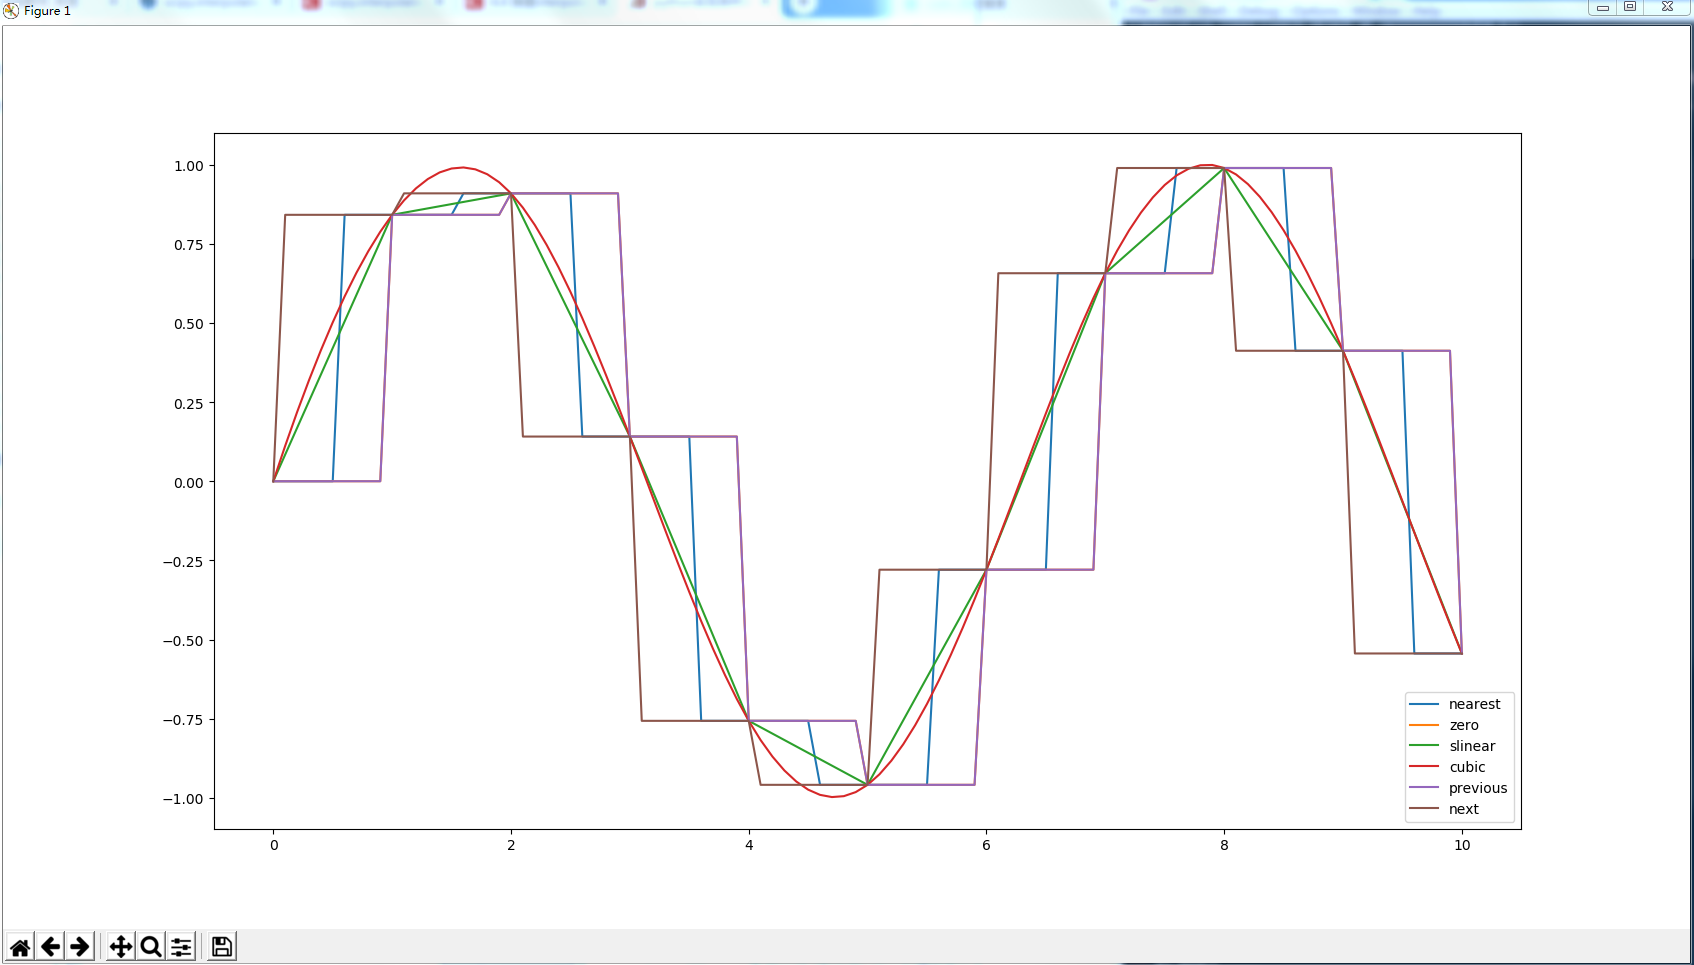
>>> kind_lst = ['nearest', 'zero', 'slinear', 'cubic', 'previous', 'next']
>>> for k in kind_lst:
f = interp1d(x,y,kind=k)
y_new = f(x_new)
pl.plot(x_new, y_new, label=k)
[<matplotlib.lines.Line2D object at 0x000000000F74CE08>]
[<matplotlib.lines.Line2D object at 0x000000000F6FF948>]
[<matplotlib.lines.Line2D object at 0x000000000DC41908>]
[<matplotlib.lines.Line2D object at 0x000000000F757FC8>]
[<matplotlib.lines.Line2D object at 0x000000000F6FF808>]
[<matplotlib.lines.Line2D object at 0x000000000F6F3908>]
>>>
>>> pl.legend(loc="lower right")
<matplotlib.legend.Legend object at 0x000000000DEC9C08>
>>> pl.show()
>>> 
发布者:全栈程序员-站长,转载请注明出处:https://javaforall.net/133423.html原文链接:https://javaforall.net


