
大家好,又见面了,我是你们的朋友全栈君。
原因:
前段时间,公司项目中用到Visifire.Charts4.5.6控件,项目中要求随时可以控制动画效果,用于在大屏上面展示,很酷炫。
过程:
但是没有源码,于是写了一个方法用动画去控制数量动态增长,无奈效率太低,多实例几个Chart就卡到爆,放弃。
没有源码,怎么办呢,无奈之下反编译了一下dll,刚开始用reflector反编译,发现编译出来的大部分都用不了。然后又用ILSpy反编译,生成的代码还是有错误,但是已然少很多,于是稍加改动,就可以通过编译了。
反编译出来的代码能运行,就成功一大半了,然后花了大半月时间调试源码,添加动态控制动画方法,控制动画的时间,最终成功,后面有效果和Demo。
动画功能完成了,但反编译出来的代码还是有一些问题,这种反编译出来有些符号识别不了导致运行出来的图表总是多出来一条线。这个对于强迫症的我来说很难受啊,于是又花了好几天功夫调试啊,各种方法使尽啊就是找不到问题所在,最后又拿出Visifire.Charts3.6.1的源码来一个一个对比差异,这两个版本差异较大,一时半会没弄出来,最后还是无意间发现反编译将i++调用了多次导致,修改之后,完全正确了,喜出望外啊,强迫症解决了,完美。
诞生:
为了区别原来的Visifire.Charts4.5.6,我将封装了动画控制,新编译出来的代码修改为了WPFVisifire.Charts4.6.1。
说了这么多,贴一些使用代码吧,后面附加Visifire.Charts3.6.1、Visifire.Charts4.5.6、WPFVisifire.Charts4.6.1
示例:
XAML:
<Window x:Class="VisifireDemo.MainWindow"
        xmlns="http://schemas.microsoft.com/winfx/2006/xaml/presentation"
        xmlns:x="http://schemas.microsoft.com/winfx/2006/xaml"
        xmlns:vc="clr-namespace:Visifire.Charts;assembly=WPFVisifire.Charts"
        Title="MainWindow" Height="600" Width="800" WindowStartupLocation="CenterScreen" Loaded="Window_Loaded">
    <Grid x:Name="grid" Background="#1E1E1E">
        <Grid.RowDefinitions>
            <RowDefinition Height="50"/>
            <RowDefinition/>
        </Grid.RowDefinitions>
        <WrapPanel x:Name="wrap" VerticalAlignment="Center">
            <ComboBox x:Name="cbChartType" Width="120" Height="40" SelectionChanged="cbChartType_SelectionChanged"/>
            <Button x:Name="btnChartSet" Width="100" Height="40" Content="图形设置" Click="btnChartSet_Click"/>
            <Button x:Name="btnTagSet" Width="100" Height="40" Content="标签设置" Click="btnTagSet_Click"/>
            <Button x:Name="btnRandomValue" Width="100" Height="40" Content="随机值" Click="btnRandomValue_Click"/>
            <Button x:Name="btnAnimated" Width="100" Height="40" Content="动画" Click="btnAnimated_Click"/>
        </WrapPanel>
        <vc:Chart x:Name="chart" Grid.Row="1"/>
    </Grid>
</Window>
后代代码:
using System;
using System.Collections.Generic;
using System.Linq;
using System.Text;
using System.Threading;
using System.Threading.Tasks;
using System.Windows;
using System.Windows.Controls;
using System.Windows.Data;
using System.Windows.Documents;
using System.Windows.Forms;
using System.Windows.Input;
using System.Windows.Media;
using System.Windows.Media.Animation;
using System.Windows.Media.Imaging;
using System.Windows.Navigation;
using System.Windows.Shapes;
using Visifire.Charts;

namespace VisifireDemo
{
    /// <summary>
    /// MainWindow.xaml 的交互逻辑
    /// </summary>
    public partial class MainWindow : Window
    {
        private Axis NewAxis()
        {
            var axisLabels = new AxisLabels();
            axisLabels.FontColor = Brushes.White;
            var _axis = new Axis { AxisLabels = axisLabels };
            _axis.Grids.Add(new ChartGrid());
            return _axis;
        }

        /// <summary>
        /// 初始化图表控件
        /// </summary>
        private void InitChart()
        {
            this.chart.BorderBrush = Brushes.Transparent;
            this.chart.Background = Brushes.Transparent;
            this.chart.LightingEnabled = false;
            this.chart.ThemeEnabled = false;
            this.chart.ShadowEnabled = false;
            this.chart.View3D = true;
            this.chart.AnimationEnabled = true;//加载动画
            this.chart.AnimatedUpdate = true;//更新动画
            this.chart.AnimationDuration = 5.0;//动画时长

            var _axisX = NewAxis();
            var _axisY = NewAxis();
            _axisY.Suffix = "斤";
            _axisY.AxisMaximum = 200;
            _axisY.AxisMinimum = 0;

            this.chart.AxesX.Add(_axisX);
            this.chart.AxesY.Add(_axisY);

            this.chart.PlotArea = new PlotArea()
            {
                Background = Brushes.Transparent,
                ShadowEnabled = false
            };
        }

        /// <summary>
        /// 绑定数据
        /// </summary>
        private void BindingData()
        {
            this.chart.Series.Clear();
            this.chart.Titles.Clear();
            this.chart.Titles.Add(new Title() { Text = "标题", FontColor = Brushes.Tomato, FontSize = 14 });

            DataSeries dataSeries = new DataSeries();
            DataPointCollection list = new DataPointCollection();
            for (int i = 0; i < 9; i++)
            {
                DataPoint dataPoint = new DataPoint();
                dataPoint.Enabled = true;
                dataPoint.Exploded = false;
                dataPoint.AxisXLabel = "name" + i;
                dataPoint.YValue = (i + 1) * 10;
                dataPoint.Background = Brushes.Red;
                dataPoint.MouseLeftButtonDown += (ss, ee) => { dataPoint.Exploded = !dataPoint.Exploded; };
                list.Add(dataPoint);
            }
            dataSeries.DataPoints = list;
            dataSeries.LabelFontColor = Brushes.White;
            dataSeries.LabelAngle = 0;
            dataSeries.RenderAs = RenderAs.Column;
            dataSeries.LightingEnabled = true;
            dataSeries.LabelEnabled = true;
            this.chart.Series.Add(dataSeries);
        }

        /// <summary>
        /// 加载图表控件类型
        /// </summary>
        private void LoadChartType()
        {
            var es = Enum.GetNames(typeof(RenderAs));
            foreach (var item in es)
            {
                this.cbChartType.Items.Add(item);
            }
        }

        public MainWindow()
        {
            InitializeComponent();
            this.LoadChartType();
            this.InitChart();
            this.BindingData();
        }

        private void Window_Loaded(object sender, RoutedEventArgs e)
        {

        }

        private void cbChartType_SelectionChanged(object sender, SelectionChangedEventArgs e)
        {
            this.chart.Series[0].RenderAs = (RenderAs)Enum.Parse(typeof(RenderAs), this.cbChartType.SelectedItem.ToString());
        }

        private void btnChartSet_Click(object sender, RoutedEventArgs e)
        {
            var window = new ChartSetWindow(this.chart);
            window.Owner = this;
            window.Show();
        }

        private void btnTagSet_Click(object sender, RoutedEventArgs e)
        {
            var window = new TagSetWindow(this.chart);
            window.Owner = this;
            window.Show();
        }

        private void btnRandomValue_Click(object sender, RoutedEventArgs e)
        {
            foreach (var item in this.chart.Series)
            {
                foreach (var s in item.DataPoints)
                {
                    s.YValue = new Random().Next(0, 100);
                    Thread.Sleep(20);
                }
            }
        }

        private void btnAnimated_Click(object sender, RoutedEventArgs e)
        {
            this.chart.RenderAnimate();
        }
    }
}
运行效果:
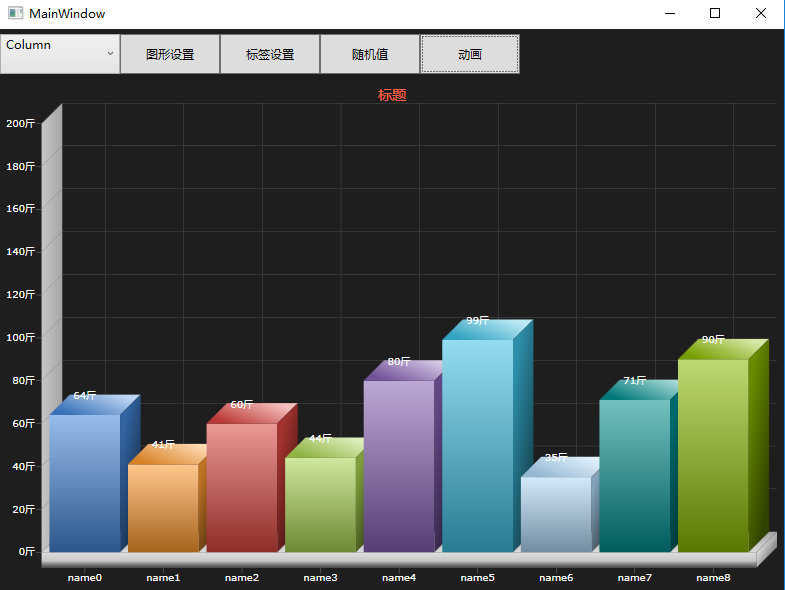

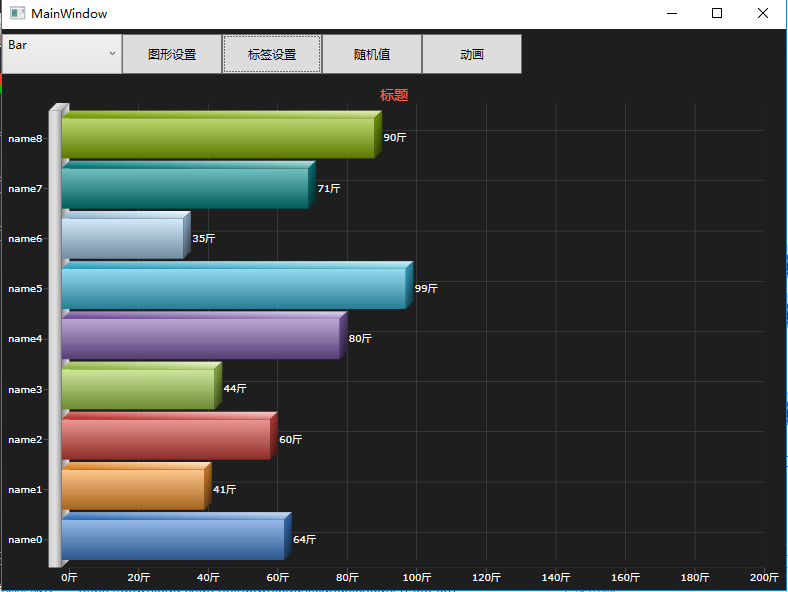
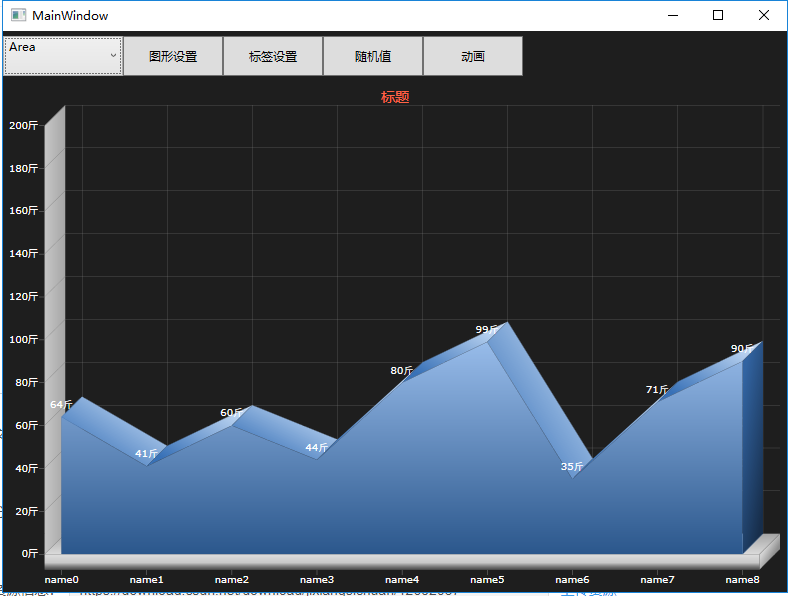
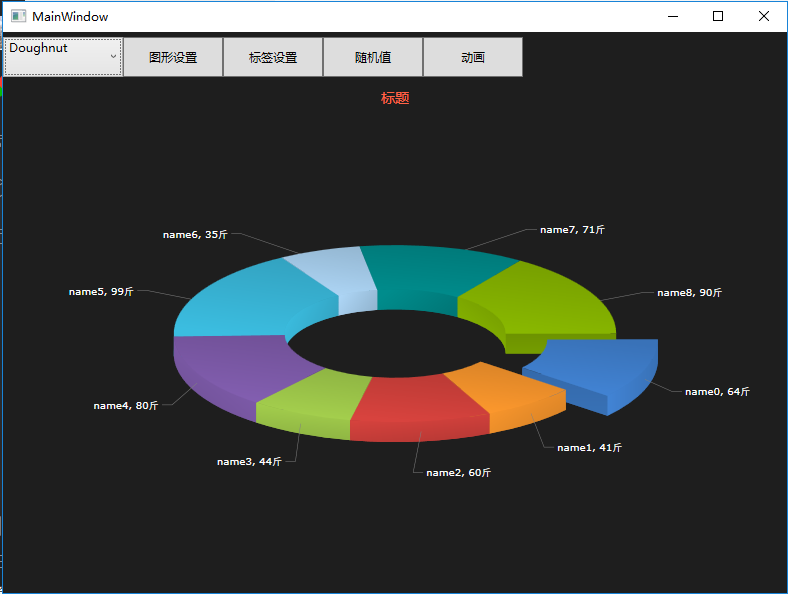
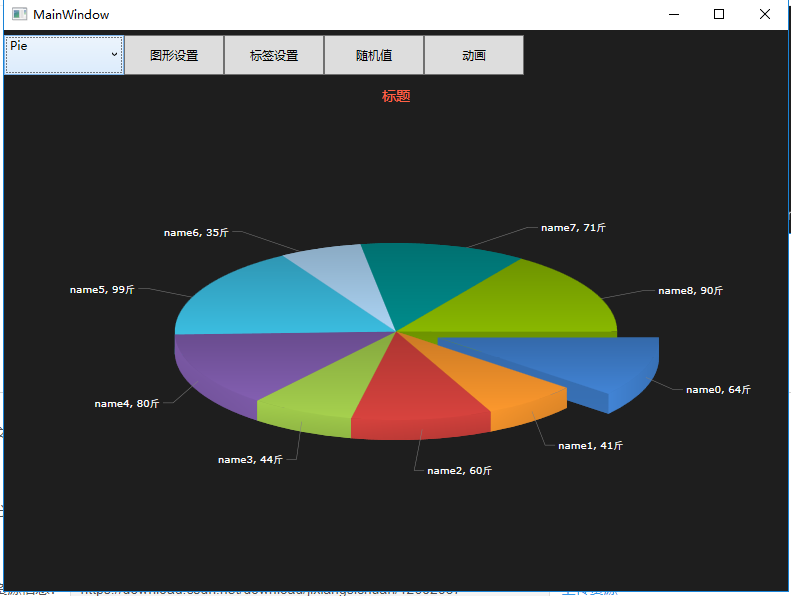
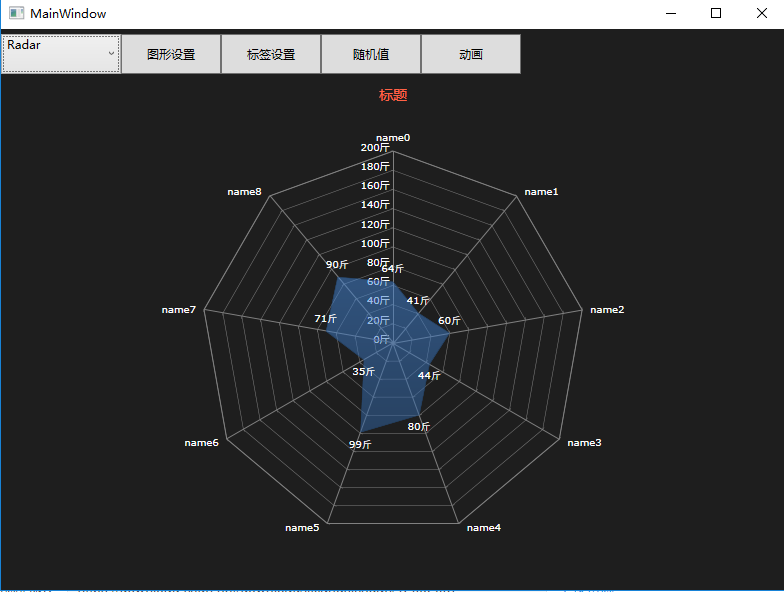
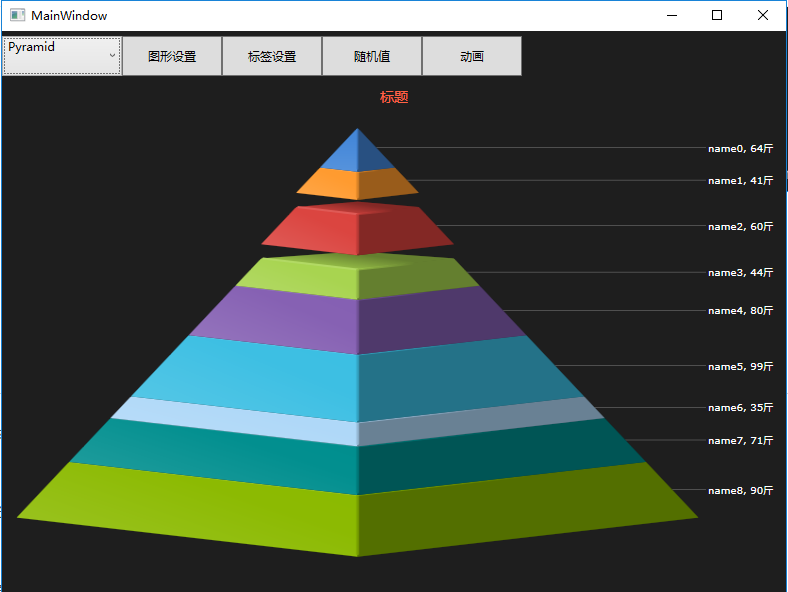
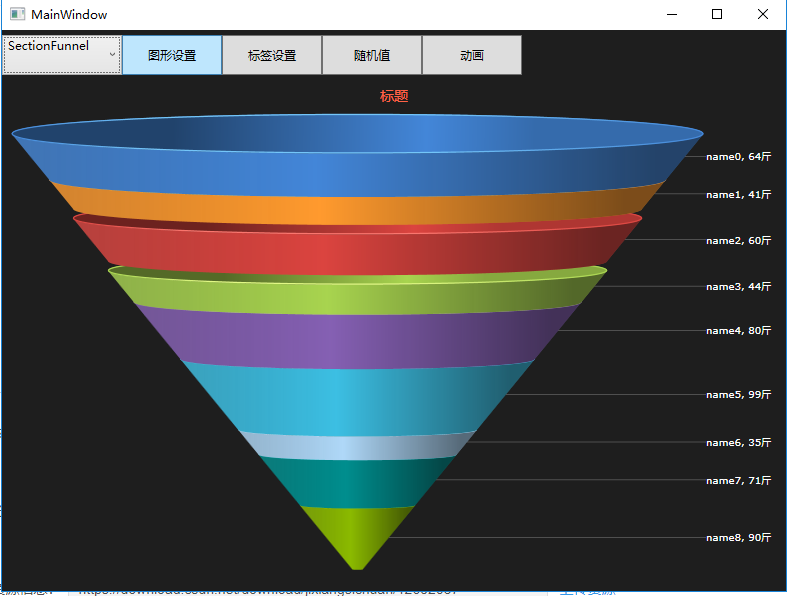
更多效果,下载Demo运行看吧!后面持续更新更多WPF样式控件,欢迎关注哟!
发布者:全栈程序员-站长,转载请注明出处:https://javaforall.net/162788.html原文链接:https://javaforall.net


