
大家好,又见面了,我是你们的朋友全栈君。如果您正在找激活码,请点击查看最新教程,关注关注公众号 “全栈程序员社区” 获取激活教程,可能之前旧版本教程已经失效.最新Idea2022.1教程亲测有效,一键激活。
Jetbrains全系列IDE稳定放心使用
最近用R语言画图,plot 函数是用的最多的函数,而他的参数非常繁多,由此总结一下,以供后续方便查阅。
plot(x, y = NULL, type = “p”, xlim = NULL, ylim = NULL,
log = “”, main = NULL, sub = NULL, xlab = NULL, ylab = NULL,
ann = par(“ann”), axes = TRUE, frame.plot = axes,
panel.first = NULL, panel.last = NULL, asp = NA, …)
plot 支持R 模块有:functions,data.frames,density,factor,table等常用结构。
plot参数:
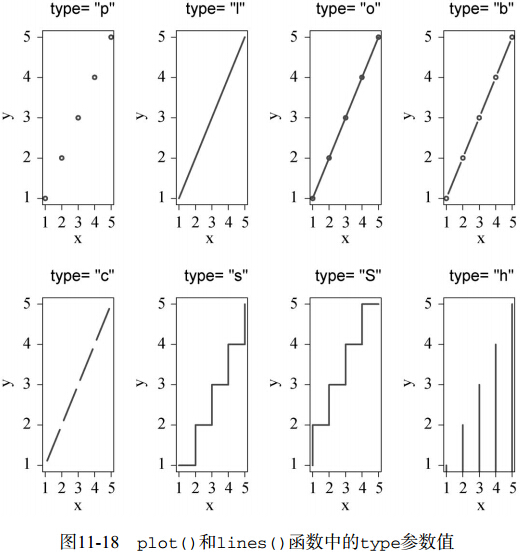
(1)type类型

(2)xlim, x 用 (x1, x2) 限制 plot 的x 轴。同理,ylim,y 用(y1,y2)限制plot的y轴。
(3)main,给图片加标题.main=”这是一幅图的标题”.
或者
title(“Main Title”, sub = “sub title”,
cex.main = 2, font.main= 4, col.main= “blue”,
cex.sub = 0.75, font.sub = 3, col.sub = “red”)
(4) xlab =“这是X轴表示什么”,ylab =“这是Y轴表示什么”
(5)axes指示是否两个坐标轴都画出。
(6) asp 限定 y/x aspect 比率
(7) points and lines
参数描述
pch 指定绘制点时使用的符号

cex 指定符号的大小。cex是一个数值,表示绘图符号相对于默认大小的缩放倍数。默认大小为1,1.5表示放大为默认值的1.5倍,0.5表示缩小为默认值的50%,等等
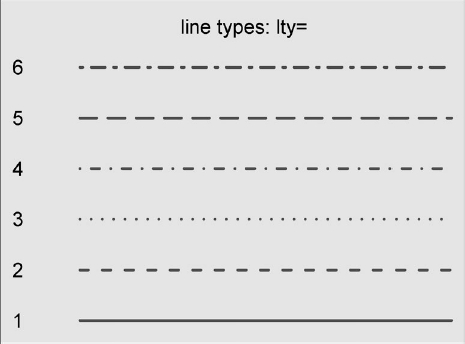
lty 指定线条类型
lwd 指定线条宽度。lwd是以默认值的相对大小来表示的(默认值为1)。例如,lwd=2将生成一条两倍于默认宽度的线条
(2)颜色
用于指定颜色的参数
col 默认的绘图颜色。某些函数(如lines和pie)可以接受一个含有颜色值的向量并自动循环使用。例如,如果设定col=c(“red”, “blue”)并需要绘制三条线,则第一条线将为红色,第二条线为蓝色,第三条线又将为红色
col.axis 坐标轴刻度文字的颜色
col.lab 坐标轴标签(名称)的颜色
col.main 标题颜色
col.sub 副标题颜色
fg 图形的前景色
bg 图形的背景色
(3)字体
用于指定文本大小的参数
cex 表示相对于默认大小缩放倍数的数值。默认大小为1,1.5表示放大为默认值的1.5倍,0.5表示缩小为默认值的50%,等等
cex.axis 坐标轴刻度文字的缩放倍数。类似于cex
cex.lab 坐标轴标签(名称)的缩放倍数。类似于cex
cex.main 标题的缩放倍数。类似于cex
cex.sub 副标题的缩放倍数。类似于cex
用于指定字体族、字号和字样的参数
font 整数。用于指定绘图使用的字体样式。1=常规,2=粗体,3=斜体,4=粗斜体,5=符号字体(以Adobe符号编码表示)
font.axis 坐标轴刻度文字的字体样式
font.lab 坐标轴标签(名称)的字体样式
font.main 标题的字体样式
font.sub 副标题的字体样式
ps 字体磅值(1磅约为1/72英寸)。文本的最终大小为 ps*cex
family 绘制文本时使用的字体族。标准的取值为serif(衬线)、sans(无衬线)和mono(等宽)
(4)图形尺寸和边界尺寸
用于控制图形尺寸和边界大小的参数
pin 以英寸表示的图形尺寸(宽和高)
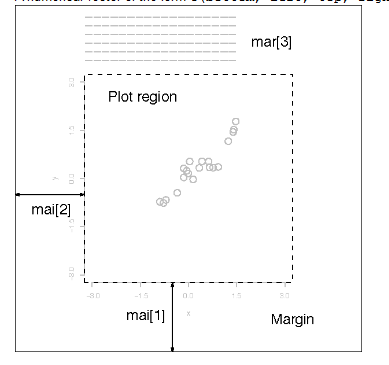
mai 以数值向量表示的边界大小,顺序为“下、左、上、右”,单位为英寸
mar 以数值向量表示的边界大小,顺序为“下、左、上、右”,单位为英分*。默认值为c(5, 4, 4, 2) + 0.1
(8) Title,text,mtext
title(main = NULL, sub = NULL, xlab = NULL, ylab = NULL,
line = NA, outer = FALSE, …) 主要指定标题字体,大小,颜色,以及X和Y坐标轴的字体,大小,颜色。
|
main |
The main title (on top) using font, size (character expansion) and color par(c(“font.main”, “cex.main”, “col.main”)). |
|
sub |
Sub-title (at bottom) using font, size and color par(c(“font.sub”, “cex.sub”, “col.sub”)). |
|
xlab |
X axis label using font, size and color par(c(“font.lab”, “cex.lab”, “col.lab”)). |
|
ylab |
Y axis label, same font attributes as xlab. |
|
line |
specifying a value for line overrides the default placement of labels, and places them this many lines outwards from the plot edge. |
|
outer |
a logical value. If TRUE, the titles are placed in the outer margins of the plot. |
例如:title(main = list("Stopping Distance versus Speed", cex = 1.5,
col = "red", font = 3))
text(x, y = NULL, labels = seq_along(x$x), adj = NULL,
pos = NULL, offset = 0.5, vfont = NULL,
cex = 1, col = NULL, font = NULL, ...)
在给定X和Y的基础上插入一段注释,
Pos:a position specifier for the text. If specified this overrides any adj value given. Values of 1, 2, 3 and 4, respectively indicate positions below, to the left of, above and to the right of the specified coordinates.,1表示下方,2表示左方,3表示上方,4表示右方。
Labels: a character vector or expression specifying the text to be written. An attempt is made to coerce other language objects (names and calls) to expressions, and vectors and other classed objects to character vectors by as.character. If labels is longer than x and y, the coordinates are recycled to the length of labels.注释部分。
mtext(text, side = 3, line = 0, outer = FALSE, at = NA,
adj = NA, padj = NA, cex = NA, col = NA, font = NA, ...)
Text is written in one of the four margins of the current figure region or one of the outer margins of the device region。在作图的外围。
|
side |
on which side of the plot (1=bottom, 2=left, 3=top, 4=right). |
|
line |
on which MARgin line, starting at 0 counting outwards. |
Las:numeric in {0,1,2,3}; the style of axis labels. 标识坐标轴标签方向。
0:always parallel to the axis [default],
1:always horizontal,
2:always perpendicular to the axis,
3:always vertical.
发布者:全栈程序员-站长,转载请注明出处:https://javaforall.net/181575.html原文链接:https://javaforall.net


