
Matched Filtering to Improve SNR for Target Detection
This example shows how to improve the SNR by performing matched filtering.
Place an isotropic antenna element at the global origin (0;0;0). Then, place a target with a nonfluctuating RCS of 1 square meter approximately 7 km from the transmitter at (5000;5000;10). Set the operating (carrier) frequency to 10 GHz. To simulate a monostatic radar, set the InUseOutputPort property on the transmitter to true. Calculate the range and angle from the transmitter to the target.
antenna = phased.IsotropicAntennaElement(‘FrequencyRange’,[5e9 15e9]);
transmitter = phased.Transmitter(‘Gain’,20,’InUseOutputPort’,true);
fc = 10e9;
target = phased.RadarTarget(‘Model’,’Nonfluctuating’,…
‘MeanRCS’,1,’OperatingFrequency’,fc);
txloc = [0;0;0];
tgtloc = [5000;5000;10];
transmitterplatform = phased.Platform(‘InitialPosition’,txloc);
targetplatform = phased.Platform(‘InitialPosition’,tgtloc);
[tgtrng,tgtang] = rangeangle(targetplatform.InitialPosition,…
transmitterplatform.InitialPosition);
Create a rectangular pulse waveform 25 μs in duration with a PRF of 10 kHz. Use a single pulse for this example. Determine the maximum unambiguous range for the given PRF. Use the radar equation to determine the peak power required to detect a target. This target has an RCS of 1 square meter at the maximum unambiguous range for the transmitter operating frequency and gain. The SNR is based on a desired false-alarm rate of 1e-6 for a noncoherent detector.
waveform = phased.RectangularWaveform(‘PulseWidth’,25e-6,…
‘OutputFormat’,’Pulses’,’PRF’,10e3,’NumPulses’,1);
c = physconst(‘LightSpeed’);
maxrange = c/(2*waveform.PRF);
SNR = npwgnthresh(1e-6,1,’noncoherent’);
lambda = physconst(‘LightSpeed’)/target.OperatingFrequency;
Ts = 290;
dbterms = db2pow(SNR – 2*transmitter.Gain);
Pt = (4*pi)^3*physconst(‘Boltzmann’)*Ts/waveform.PulseWidth/target.MeanRCS/(lambda^2)*maxrange^4*dbterms;
Set the peak transmit power to the output value from the radar equation.
transmitter.PeakPower = Pt;
Create radiator and collector objects that operate at 10 GHz. Create a free space path for the propagation of the pulse to and from the target. Then, create a receiver and a matched filter for the rectangular waveform.
radiator = phased.Radiator(‘PropagationSpeed’,c,…
‘OperatingFrequency’,fc,’Sensor’,antenna);
channel = phased.FreeSpace(‘PropagationSpeed’,c,…
‘OperatingFrequency’,fc,’TwoWayPropagation’,false);
collector = phased.Collector(‘PropagationSpeed’,c,…
‘OperatingFrequency’,fc,’Sensor’,antenna);
receiver = phased.ReceiverPreamp(‘NoiseFigure’,0,…
‘EnableInputPort’,true,’SeedSource’,’Property’,’Seed’,2e3);
filter = phased.MatchedFilter(…
‘Coefficients’,getMatchedFilter(waveform),…
‘GainOutputPort’,true);
After you create all the objects that define your model, you can propagate the pulse to and from the target. Collect the echo at the receiver, and implement the matched filter to improve the SNR.
Generate waveform.
wf = waveform();
Transmit waveform.
[wf,txstatus] = transmitter(wf);
Radiate pulse toward the target.
wf = radiator(wf,tgtang);
Propagate pulse toward the target.
wf = channel(wf,txloc,tgtloc,[0;0;0],[0;0;0]);
Reflect it off the target.
wf = target(wf);
Propagate the pulse back to transmitter.
wf = channel(wf,tgtloc,txloc,[0;0;0],[0;0;0]);
Collect the echo.
wf = collector(wf,tgtang);
Receive target echo.
rx_puls = receiver(wf,~txstatus);
[mf_puls,mfgain] = filter(rx_puls);
Get group delay of matched filter.
Gd = length(filter.Coefficients)-1;
The group delay is constant.
Shift the matched filter output.
mf_puls=[mf_puls(Gd+1:end); mf_puls(1:Gd)];
subplot(2,1,1)
t = unigrid(0,1e-6,1e-4,'[)’);
rangegates = c.*t;
rangegates = rangegates/2;
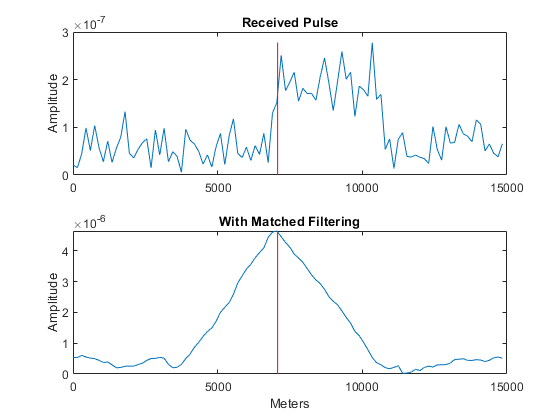
plot(rangegates,abs(rx_puls))
title(‘Received Pulse’)
ylabel(‘Amplitude’)
hold on
plot([tgtrng, tgtrng], [0 max(abs(rx_puls))],’r’)
subplot(2,1,2)
plot(rangegates,abs(mf_puls))
title(‘With Matched Filtering’)
xlabel(‘Meters’)
ylabel(‘Amplitude’)
hold on
plot([tgtrng, tgtrng], [0 max(abs(mf_puls))],’r’)
hold off

发布者:全栈程序员-站长,转载请注明出处:https://javaforall.net/202940.html原文链接:https://javaforall.net


