
概述
定期收集操作系统或应用服务的指标数据存储到Elasticsearch中,进行实时分析
metricbeat安装
去下载页下载,解压即可
metricbeat启动
./metricbeat -e metricbeat支持的输出类型:
- ElasticSearch
- LogStash
- Kafka
- Redis
- File
- Console
- Cloud
metricbeat也有很多module,需要收集哪个module的信息,即启动该module即可,命令与Filebeat类似
查module列表 ./metricbeat modules list 启用module ./metricbeat modules enable 模块名 禁用module ./metricbeat modules disable 模块名 基本属性的配置与Filebeat很类似,不再赘述
案例
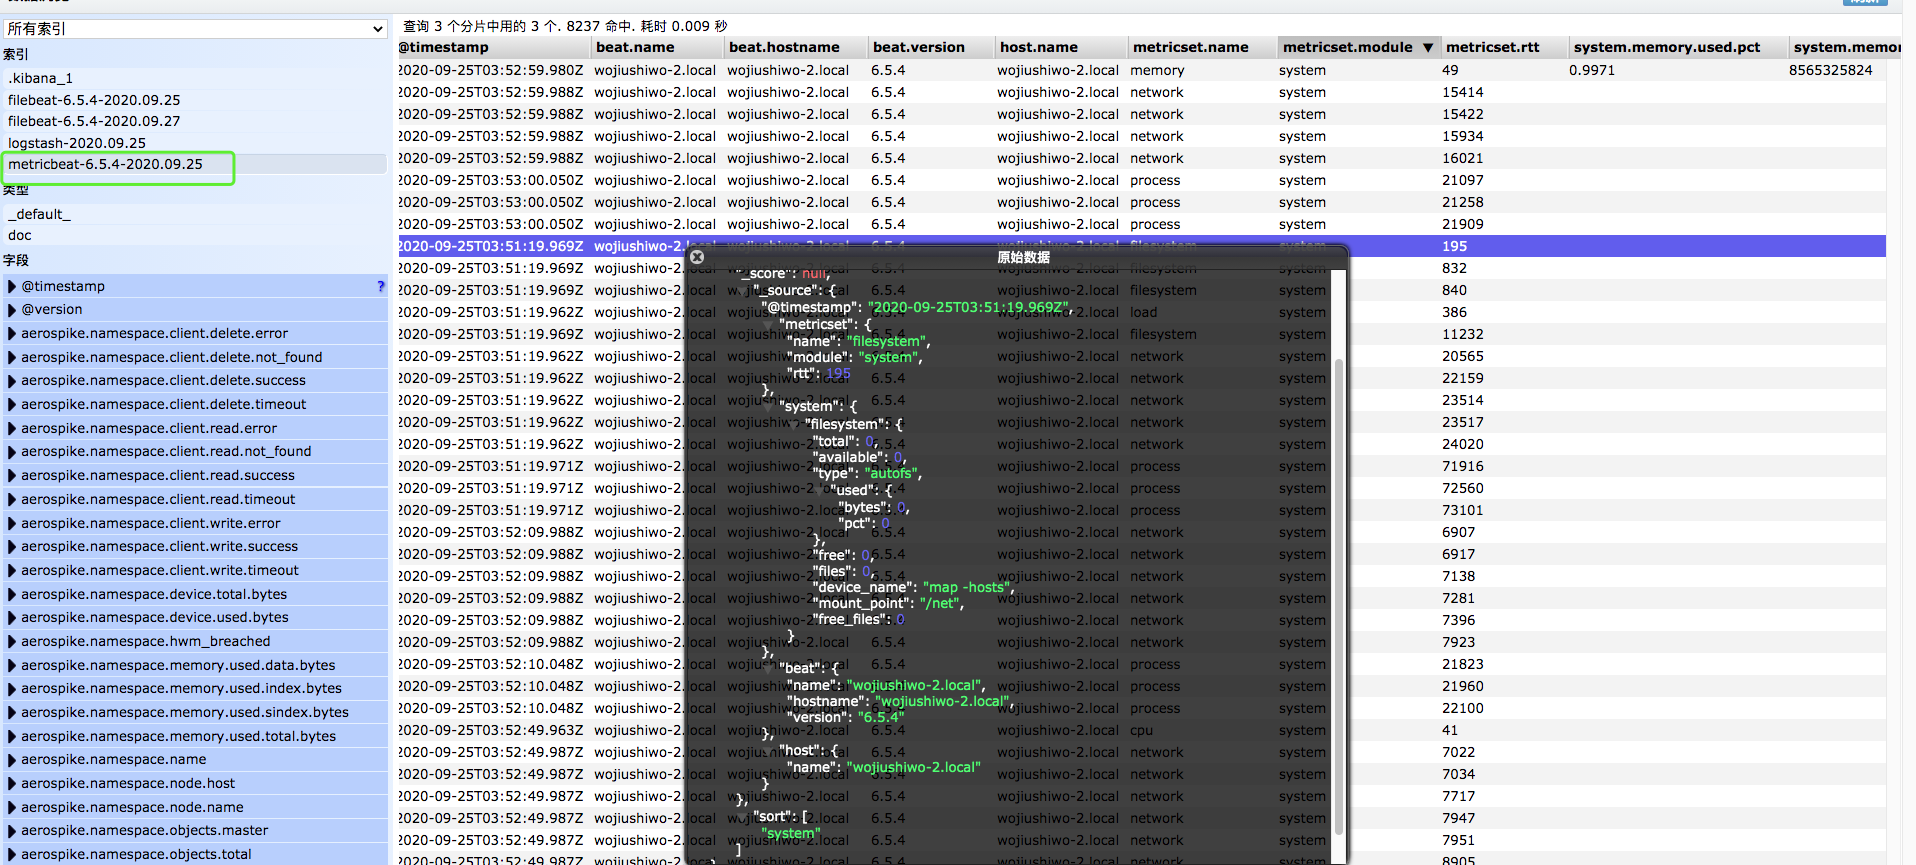
举例1:收集系统运行的指标数据至es
启用system模块
./metricbeat modules enable system system模块收集的数据定义在modules.d/system.yml下
metricbeat.yml
metricbeat.config.modules: path: ${
   path.config}/modules.d/*.yml reload.enabled: false setup.template.settings: index.number_of_shards: 1 index.codec: best_compression # #_source.enabled: false output.elasticsearch: hosts: ["http://localhost:9200"] logging.level: debug
metricbeat数据上传es默认的索引命名规则与filebeat的类似。
查看es文档数据:

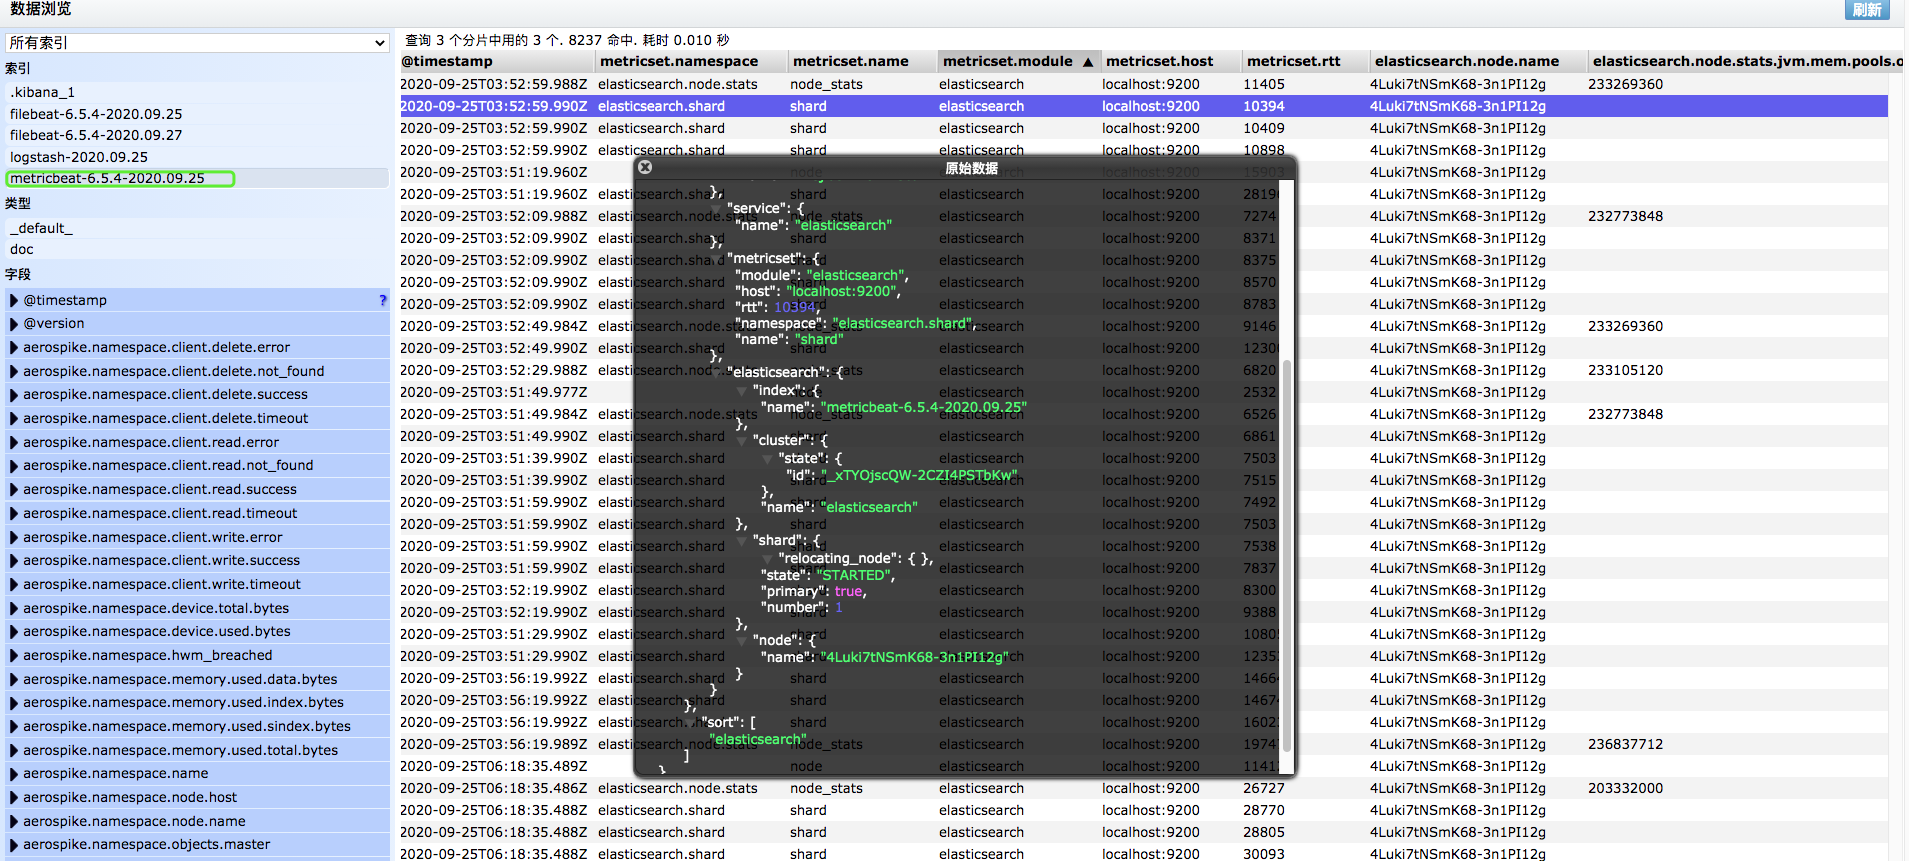
举例2:收集es运行的指标数据至es
与之前类似,启用elasticsearch模块,配置文件与上例一致。
查看es文档数据:
版权声明:本文内容由互联网用户自发贡献,该文观点仅代表作者本人。本站仅提供信息存储空间服务,不拥有所有权,不承担相关法律责任。如发现本站有涉嫌侵权/违法违规的内容, 请联系我们举报,一经查实,本站将立刻删除。
发布者:全栈程序员-站长,转载请注明出处:https://javaforall.net/213068.html原文链接:https://javaforall.net


