
峰度kurtosis:用于度量x偏离某分布的程度。- 正太分布的峰度是3;
- 当时间序列的曲线峰值比正太分布的高时,峰度大于3;
- 当比正太分布的低时,峰度小于3。
偏度skewness:用于衡量x的对称性。- 对于正太分布,偏度为0;
- 若偏度为正,则x均值左侧的离散度比右侧弱;
- 若偏度为负,则x均值左侧的离散度比右侧强。
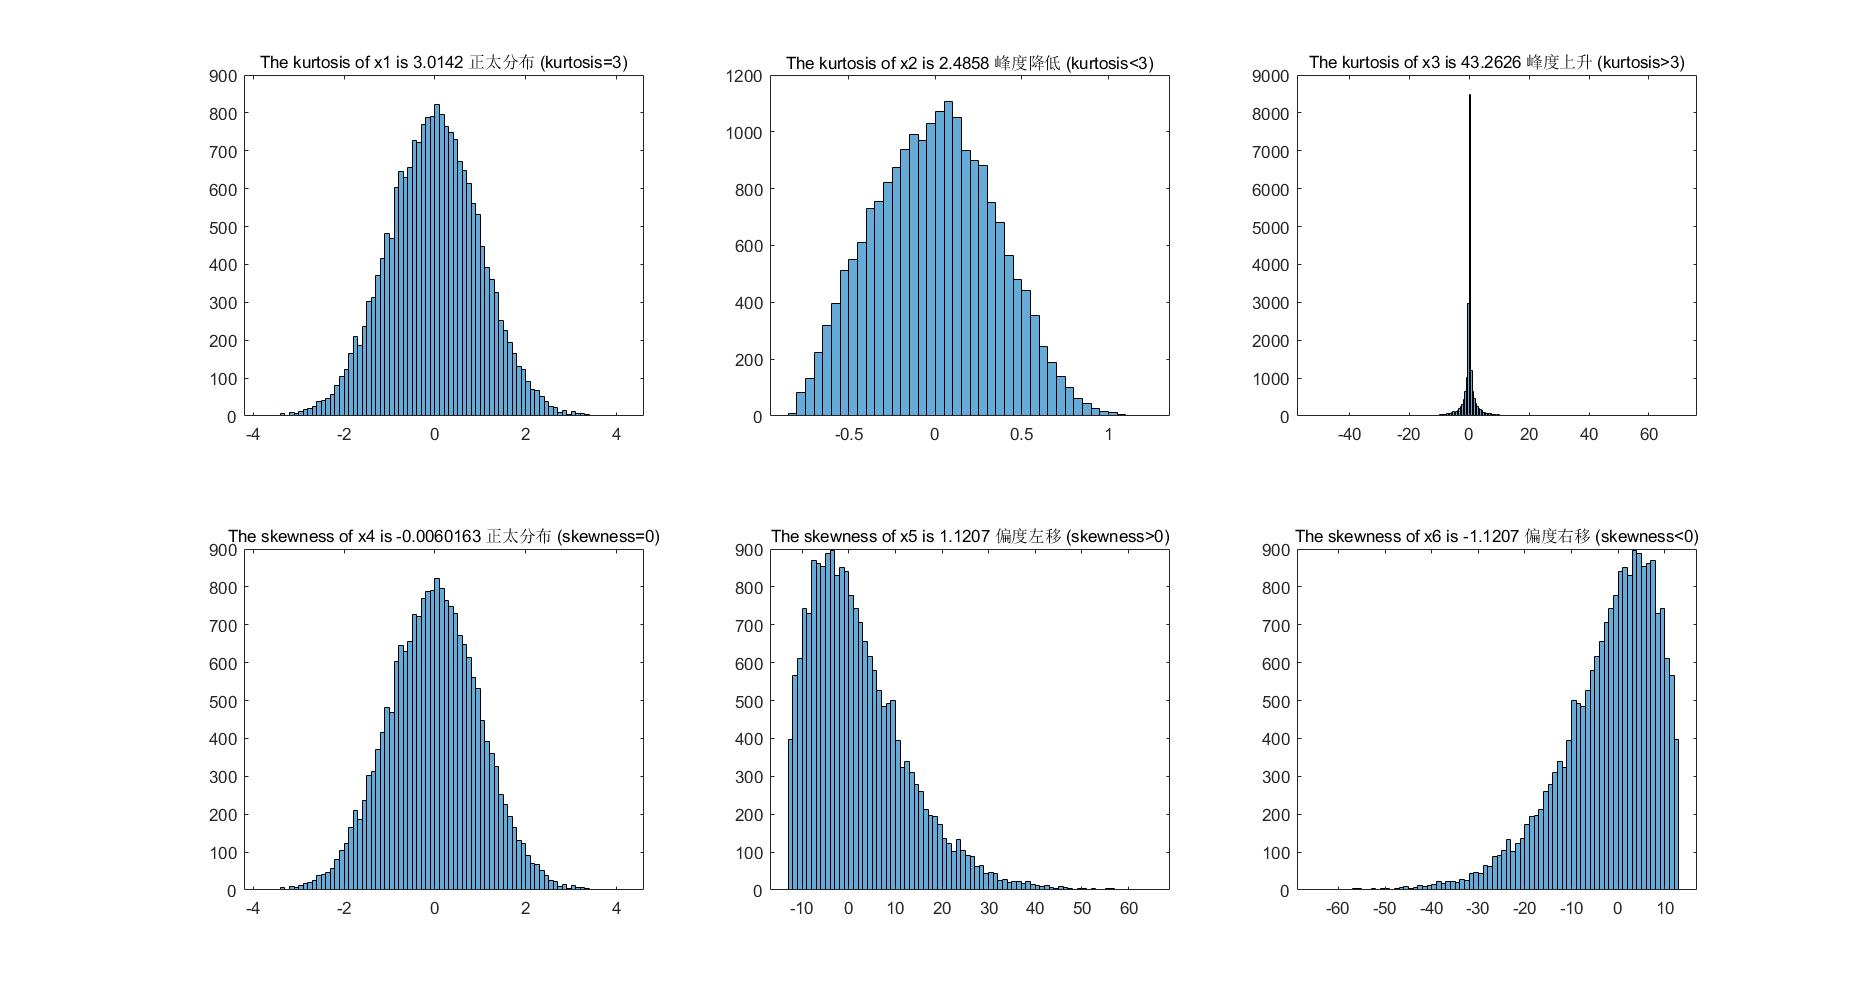

h = figure() set(h,'position',[50 50 1500 800]); x1 = randn(1,20000); subplot(231) histogram(x1) title(['The kurtosis of x1 is ',num2str(kurtosis(x1)),' 正太分布 (kurtosis=3)'],'Fontsize',10) subplot(232) x2 = sqrt(abs(x1))-mean(sqrt(abs(x1))); histogram(x2) title(['The kurtosis of x2 is ',num2str(kurtosis(x2)),' 峰度降低 (kurtosis<3)'],'Fontsize',10) subplot(233) x3 = x1.^3 - mean(x1.^3); histogram(x3) title(['The kurtosis of x3 is ',num2str(kurtosis(x3)),' 峰度上升 (kurtosis>3)'],'Fontsize',10) subplot(234) x4 = x1; histogram(x4) title(['The skewness of x4 is ',num2str(skewness(x4)),' 正太分布 (skewness=0)'],'Fontsize',10) subplot(235) m = -10 + 2*x1; % mean = -1 ; std = 2 x5 = x1.*m; histogram(x5) title(['The skewness of x5 is ',num2str(skewness(x5)),' 偏度左移 (skewness>0)'],'Fontsize',10) subplot(236) x6 = -x5 histogram(x6) title(['The skewness of x6 is ',num2str(skewness(x6)),' 偏度右移 (skewness<0)'],'Fontsize',10) 版权声明:本文内容由互联网用户自发贡献,该文观点仅代表作者本人。本站仅提供信息存储空间服务,不拥有所有权,不承担相关法律责任。如发现本站有涉嫌侵权/违法违规的内容, 请联系我们举报,一经查实,本站将立刻删除。
发布者:全栈程序员-站长,转载请注明出处:https://javaforall.net/220598.html原文链接:https://javaforall.net


