

改关的关
选项含义解释:
详细解决方案汇总
- Method breakpoints will slow down debugger a lot because of the JVM design, they are expensive to evaluate. Remove method breakpoints and consider using the regular line breakpoints. To verify that you don’t have any method breakpoints open .idea/workspace.xml file in the project root directory (or <project>.iws file if you are using the old project format) and look for any breakpoints inside the method_breakpoints node.
- Watch method return values option is enabled in the Debugger tool window. Try disabling this option to improve the performance.
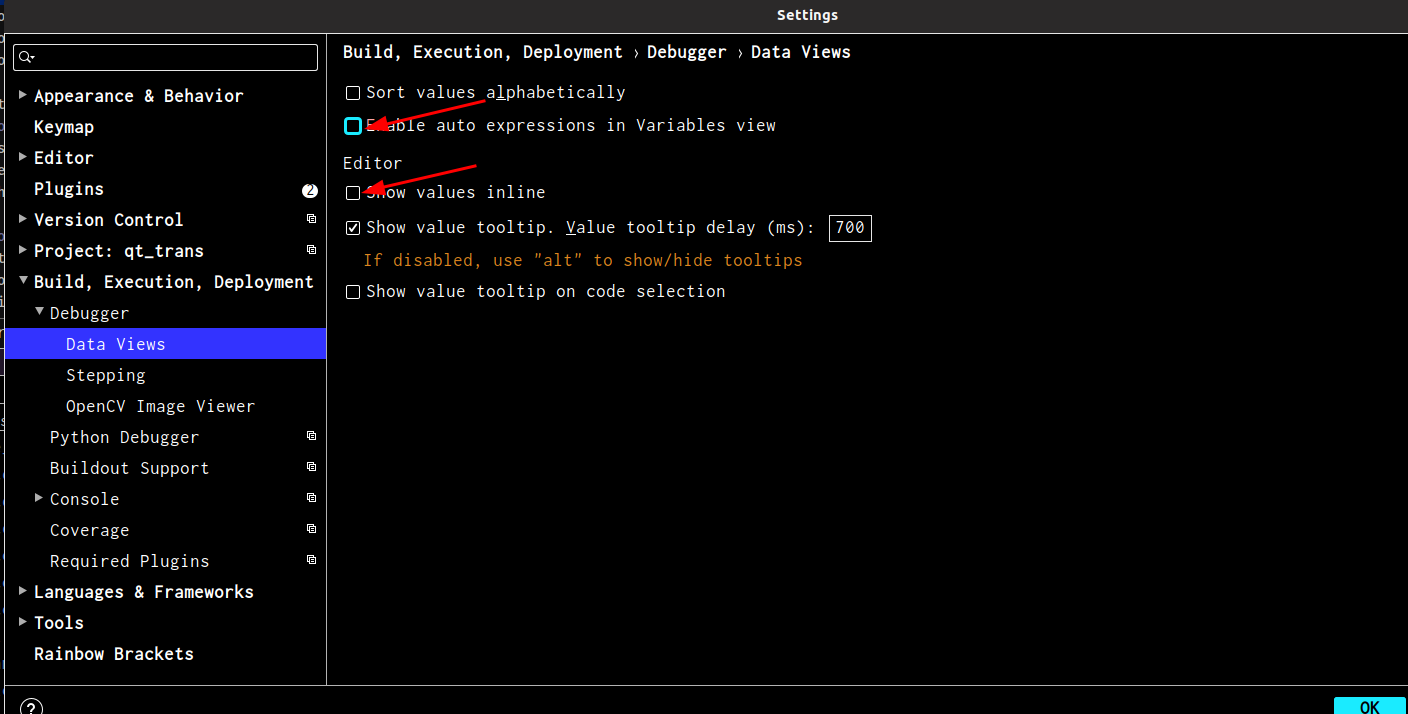
- Enable alternative views for Collections classes and Enable toString()’ object view options enabled in Settings (Preferences on macOS) | Build, Execution, Deployment | Debugger | Data Views. If toString() methods take a long time to complete, disable this option. Note that custom toString() methods can also change the semantics of the application when running under debugger in case the code inside these methods changes the state of your application.
- Memory tab in the debugger toolwindow. It is updated on every debugger stop, try to minimize it to improve stepping performance.
- Settings (Preferences on macOS) | Build, Execution, Deployment | Debugger | Data Views | Editor | Show values inline. Disable to improve performance.
- Settings (Preferences on macOS) | Build, Execution, Deployment | Debugger | Data Views | Java | Predict condition values and exceptions based on data flow analysis. Disable to improve performance.
- Enable Mute Renderers option in the Debug tool window Variables view context menu.
参考:
https://intellij-support.jetbrains.com/hc/en-us/articles/-Java-slow-performance-or-hangups-when-starting-debugger-and-stepping
版权声明:本文内容由互联网用户自发贡献,该文观点仅代表作者本人。本站仅提供信息存储空间服务,不拥有所有权,不承担相关法律责任。如发现本站有涉嫌侵权/违法违规的内容, 请联系我们举报,一经查实,本站将立刻删除。
发布者:全栈程序员-站长,转载请注明出处:https://javaforall.net/232706.html原文链接:https://javaforall.net


