
一.安装zabbix
0.关闭selinux
vim /etc/selinux/configSELINUX=disabled设置后需要重启才能生效
shell > setenforce 0 #临时关闭 shell > getenforce 检测selinux状态1.Zabbix在CentOS基本源里不可获得或者获得到的都是老版本的,因此必须配置Zabbix官方repository,可按官网步骤配置
https://www.zabbix.com/download?zabbix=4.0&os_distribution=centos&os_version=7&db=MySQL
rpm -i https://repo.zabbix.com/zabbix/4.0/rhel/7/x86_64/zabbix-release-4.0-1.el7.noarch.rpm2.安装zabbix
yum -y install zabbix-server-mysql zabbix-web-mysql zabbix-agent3.配置zabbix数据库
用于zabbix存储一些监测数据
mysql> create database zabbix character set utf8; Query OK, 1 row affected (0.00 sec) mysql> grant all privileges on zabbix.* to 'zabbix'@'localhost' identified by 'zabbix'; Query OK, 0 rows affected (0.00 sec) mysql> grant all privileges on zabbix.* to 'zabbix'@'10.130.161.21(你服务器的IP)' identified by 'zabbix'; Query OK, 0 rows affected (0.00 sec) mysql> flush privileges; Query OK, 0 rows affected (0.00 sec)导入数据库
zcat /usr/share/doc/zabbix-server-mysql*/create.sql.gz | mysql -uzabbix -p zabbix4.配置zabbix server配置
shell > vim /etc/zabbix/zabbix_server.conf其中需修改数据库相关的配置
DBHost=10.130.161.21 DBName=zabbix DBUser=zabbix DBPassword=zabbix DBPort=33065.配置zabbix agent配置
被检测客户端配置
shell > vim /etc/zabbix/zabbix_agentd.conf配置监测服务所在地址
Server=10.130.161.21 #zabbix-server服务器IP地址 ServerActive=10.130.161.21 #zabbix-server服务器IP地址 Hostname=Zabbix server #当前服务器显示名 6.设置httpd时区
vim /etc/httpd/conf.d/zabbix.confAlias /zabbix /usr/share/zabbix <Directory "/usr/share/zabbix"> Options FollowSymLinks AllowOverride None Require all granted <IfModule mod_php5.c> php_value max_execution_time 300 php_value memory_limit 128M php_value post_max_size 16M php_value upload_max_filesize 2M php_value max_input_time 300 php_value max_input_vars 10000 php_value always_populate_raw_post_data -1 php_value date.timezone Asia/Shanghai </IfModule> </Directory> <Directory "/usr/share/zabbix/conf"> Require all denied </Directory> <Directory "/usr/share/zabbix/app"> Require all denied </Directory> <Directory "/usr/share/zabbix/include"> Require all denied </Directory> <Directory "/usr/share/zabbix/local"> Require all denied </Directory>7.开启zabbix
启动zabbix server
shell > systemctl enable zabbix-server #将zabbix设为开机启动 shell > systemctl start zabbix-server #启动zabbix shell > systemctl status zabbix-server #查看zabbix是否运行启动客户端
shell > systemctl enable zabbix-agent shell > systemctl start zabbix-agent shell > systemctl status zabbix-agentcentos 6上的客户端启动方式
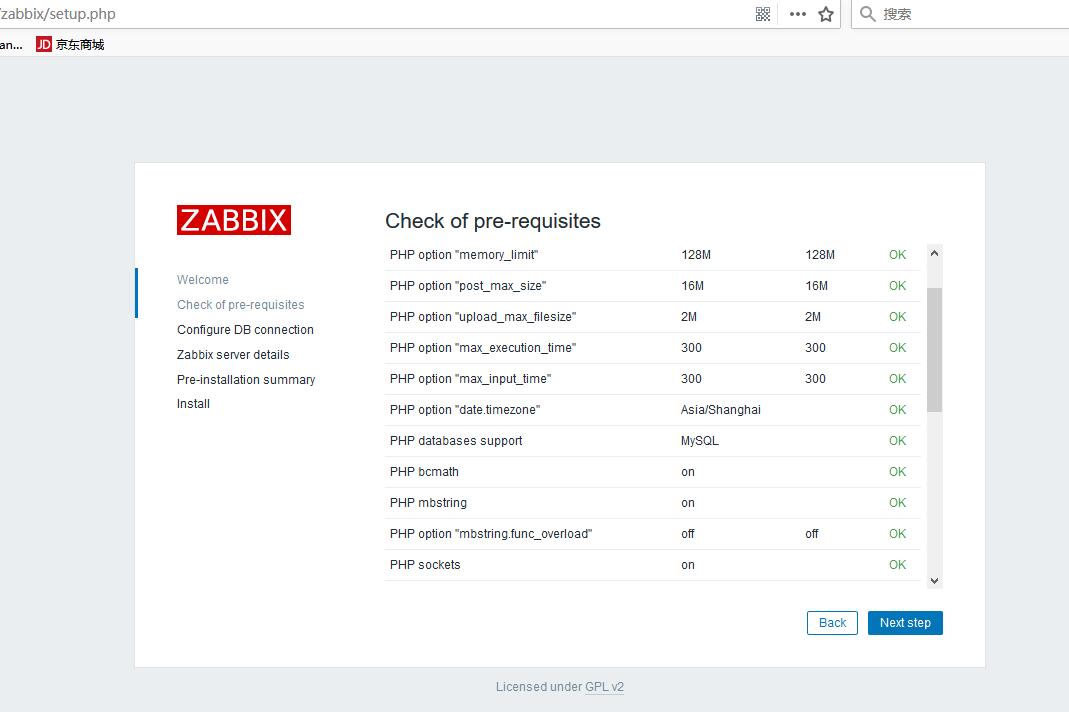
/etc/init.d/zabbix-agent start8.zabbix web配置
检查包的完整性和参数配置

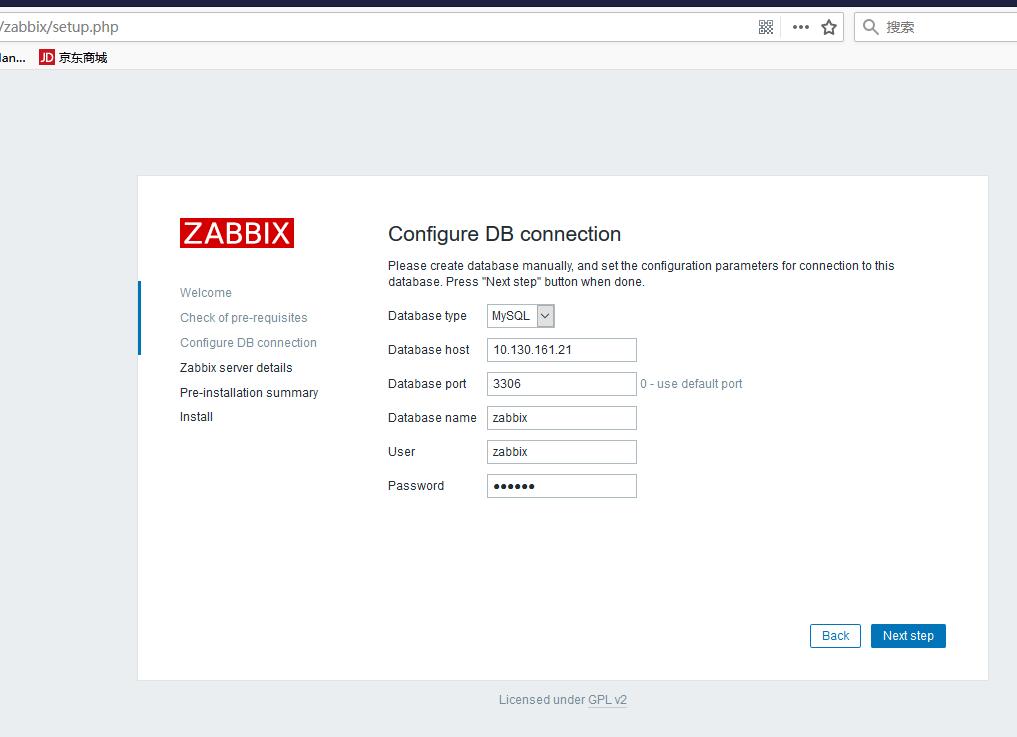
zabbix数据库配置
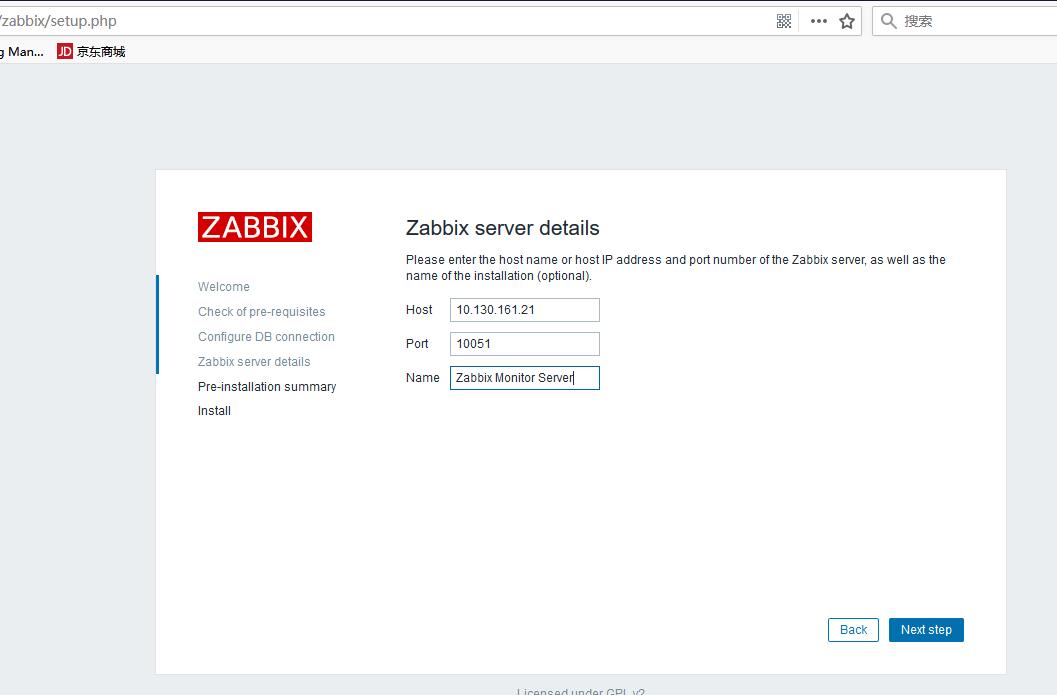
server 相关配置
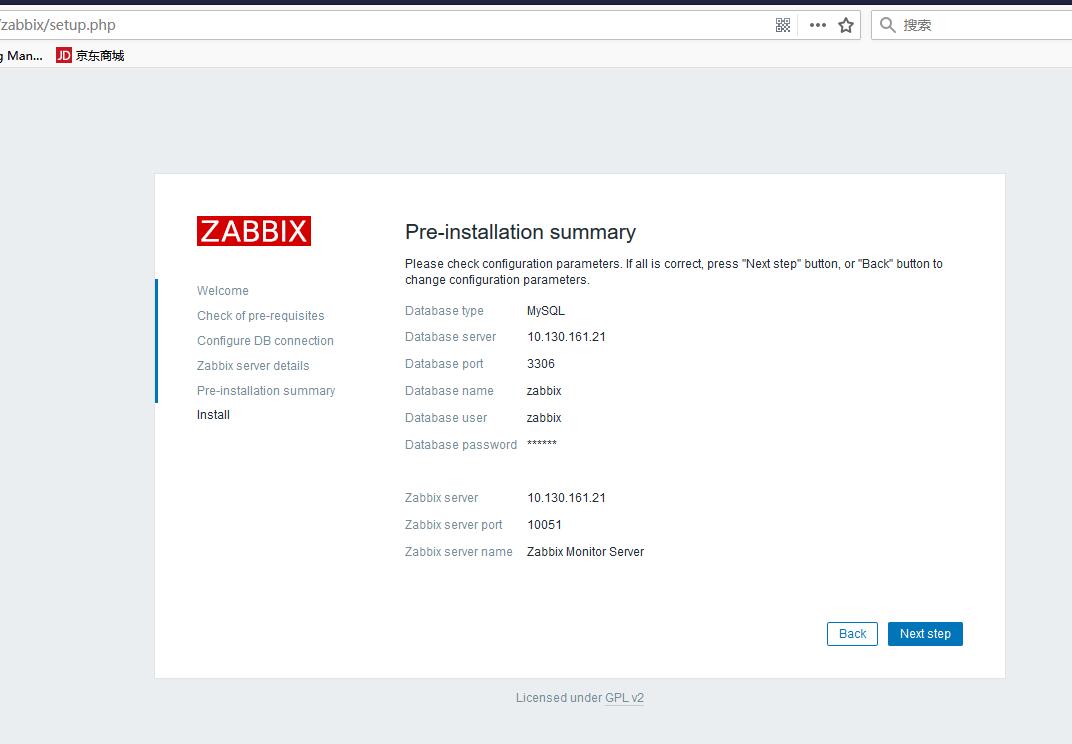
预安装摘要
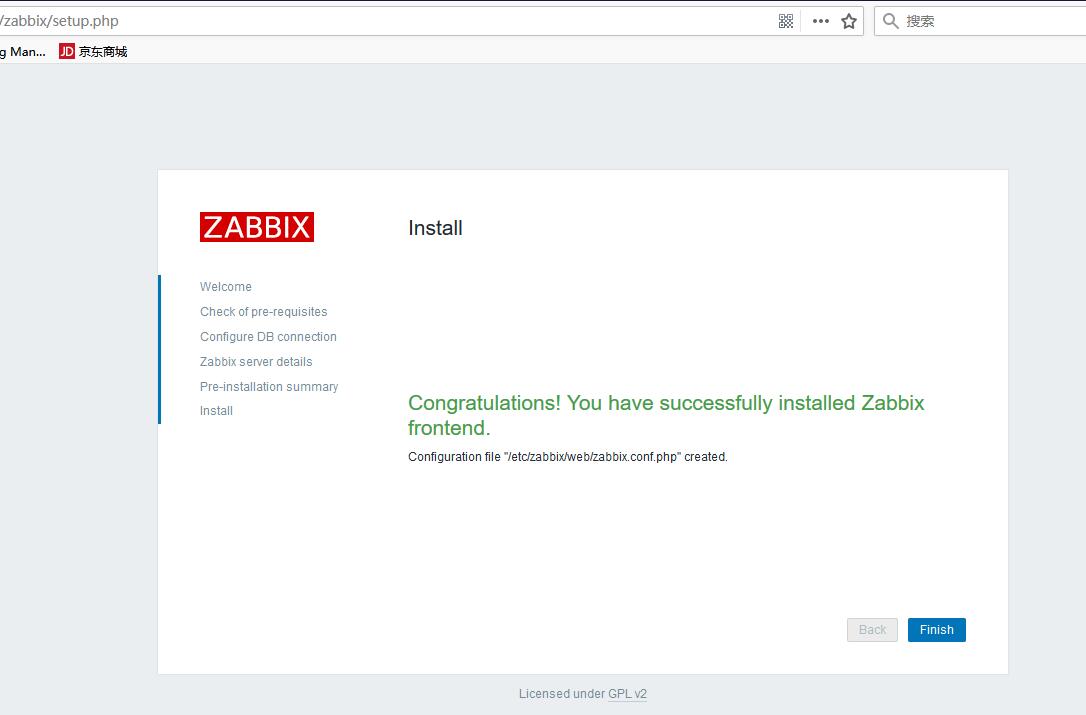
完成配置
9.配置zabbix监控
监控配置页面
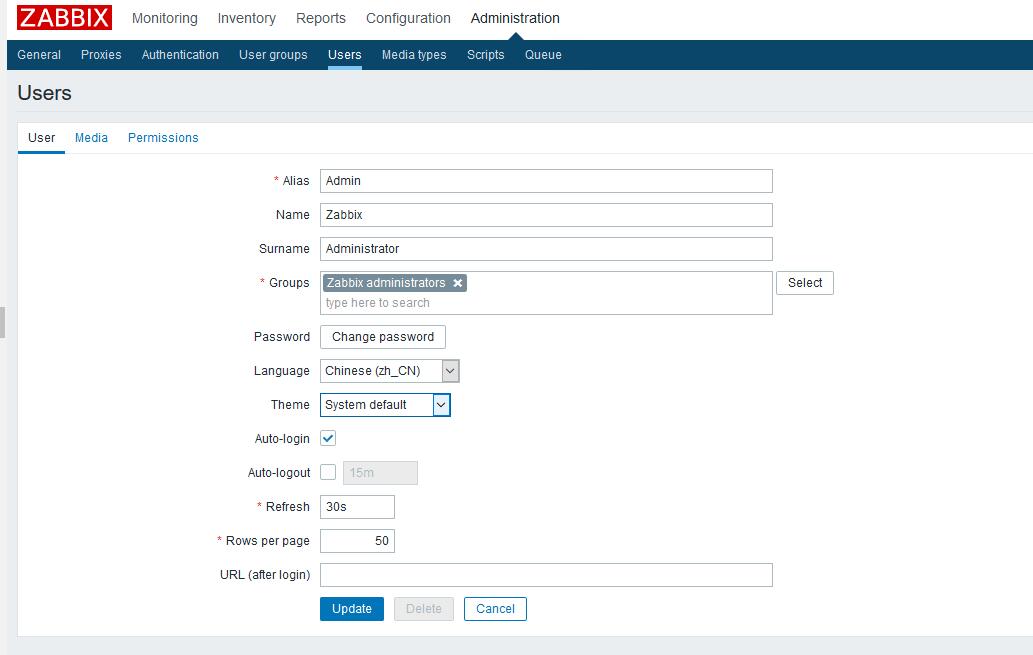
可以在这个地方更改为中文
shell > mv graphfont.ttf graphfont.ttf.bak #把graphfont.ttf备份 shell > mv simkai.ttf graphfont.ttf #把simkai.ttf 改名为graphfont.ttf然后刷新下网页就可以了
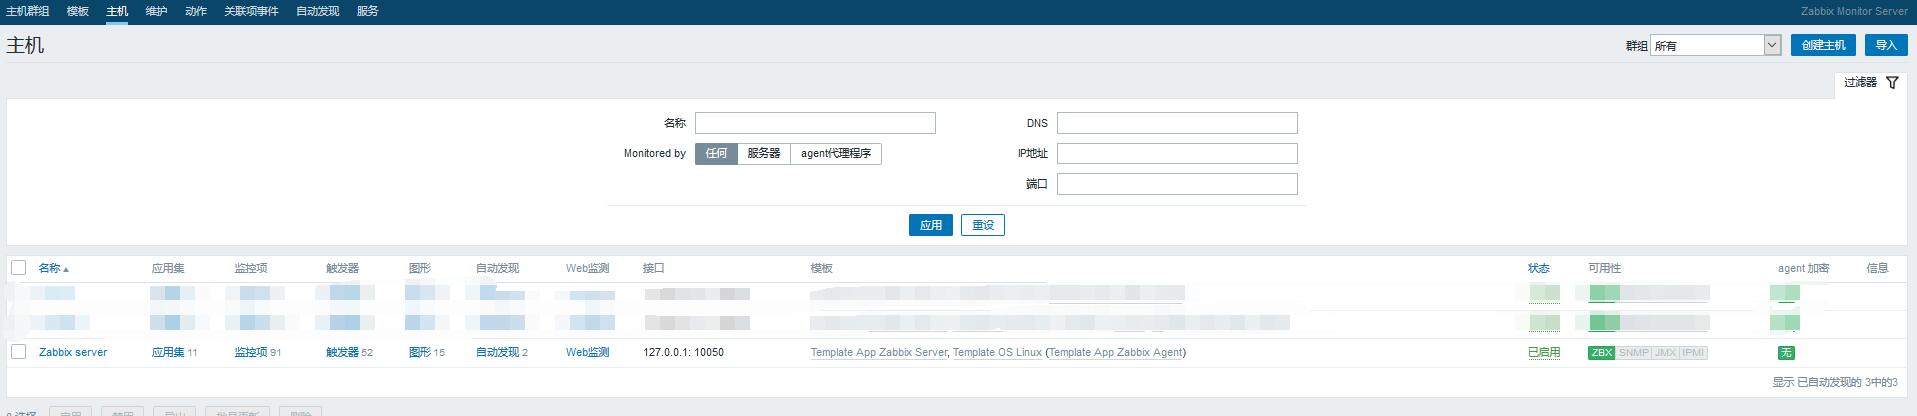
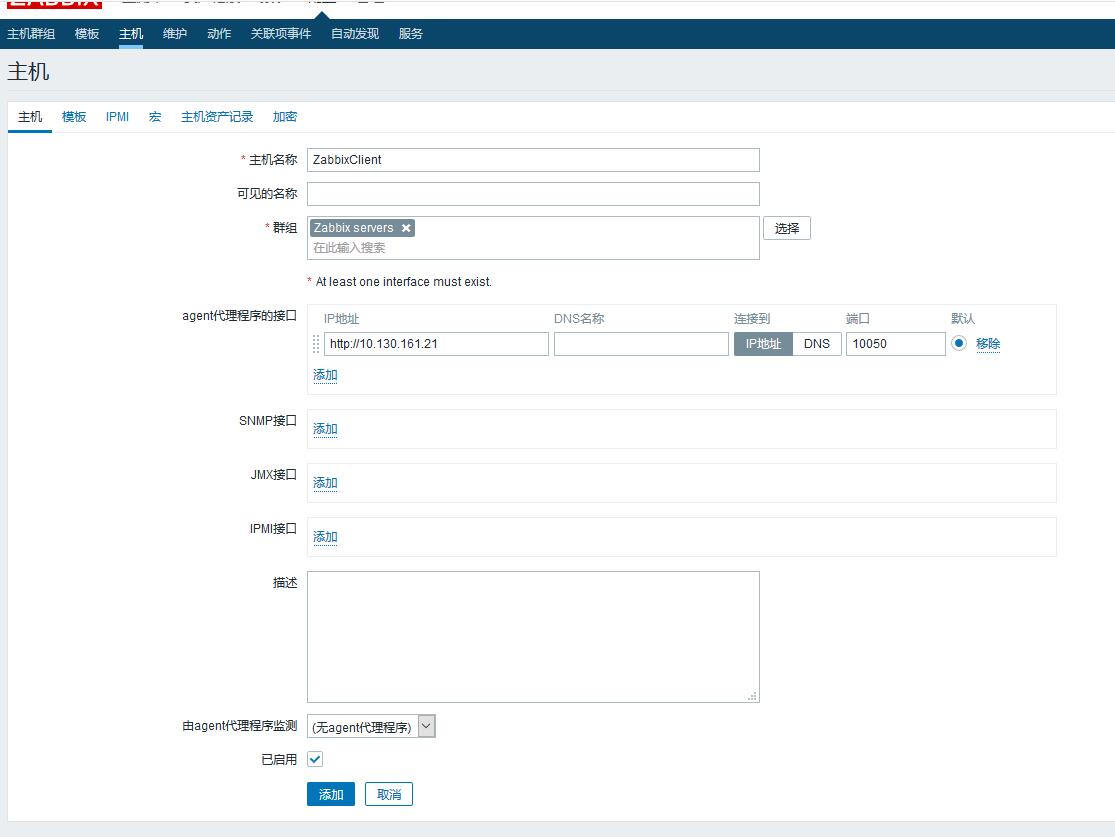
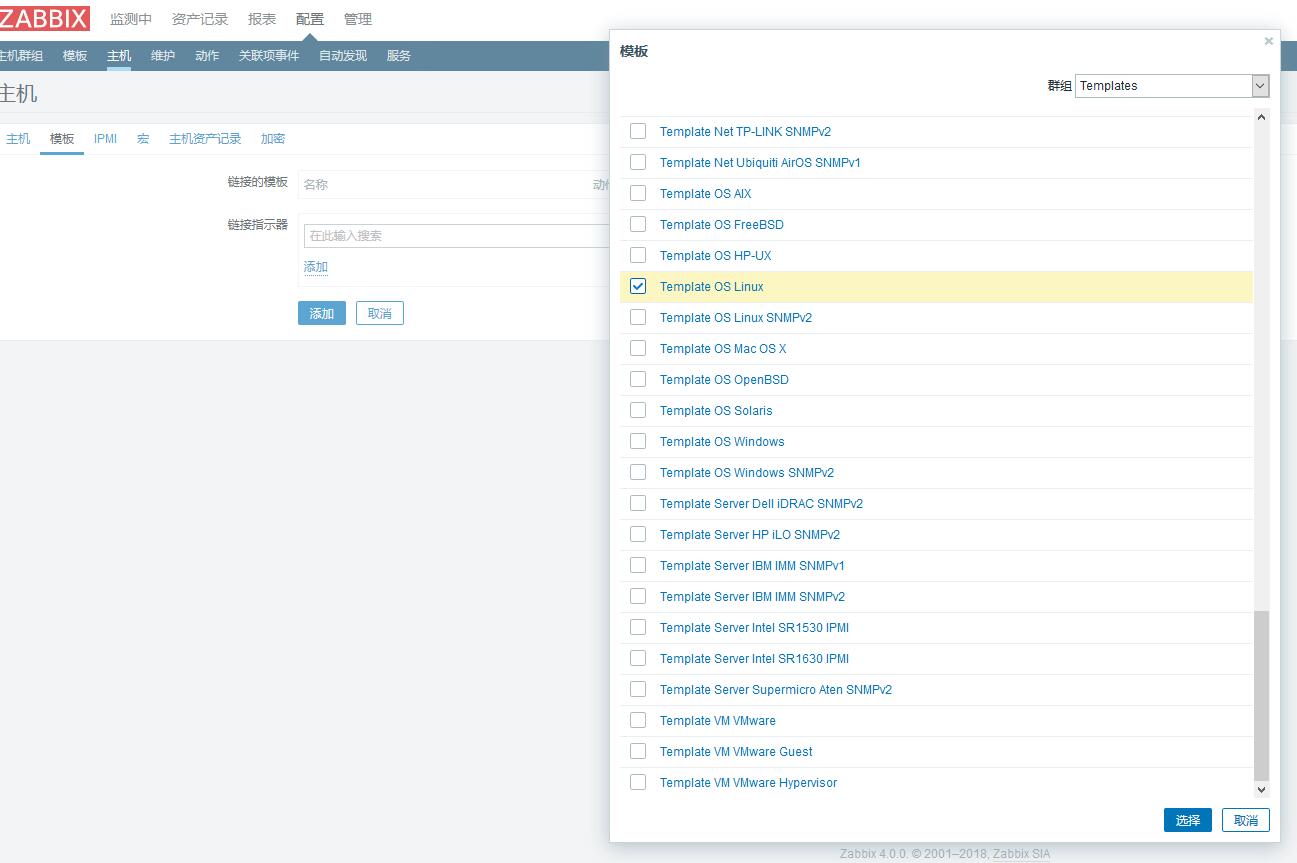
在配置->主机,添加要监控的主机
在模板子类下配置规则,这里选择Template OS Linux和Template App Zabbix Server就会监控cpu,内存,硬盘,网络信息,选择完成后,点击添加,更新,才能完成
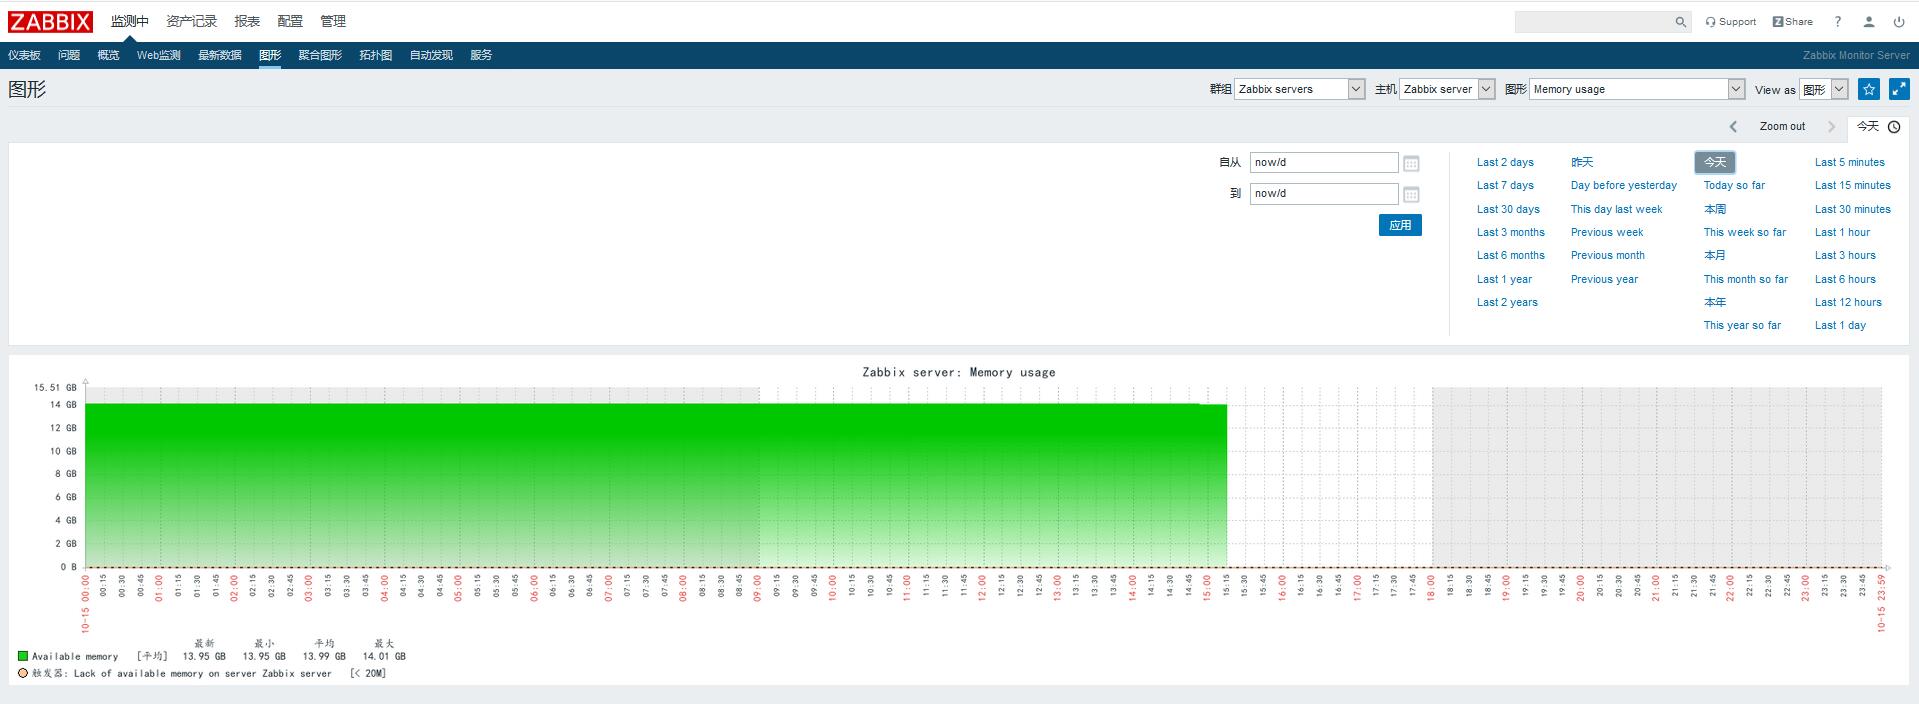
在监测中->图形页面中选择要查看的机器、参数和时间,来查看具体的参数值
二.安装Grafana
1.下载
shell > wget https://s3-us-west-2.amazonaws.com/grafana-releases/release/grafana-5.2.4-1.x86_64.rpm shell > sudo yum -y localinstall grafana-5.2.4-1.x86_64.rpm2.修改配置
vim /etc/grafana/grafana.ini在文件底部加上
[dashboards.json] enabled = true path = /var/lib/grafana/dashboards3.安装Percona仪表盘(本人安装后没有什么用,大家可以试一下)
shell > git clone https://github.com/percona/grafana-dashboards.git shell > cp -r grafana-dashboards/dashboards /var/lib/grafana shell > sed -i 's/expr=\(.\)\.replace(\(.\)\.expr,\(.\)\.scopedVars\(.*\)var \(.\)=\(.\)\.interval/expr=\1.replace(\2.expr,\3.scopedVars\4var \5=\1.replace(\6.interval, \3.scopedVars)/' /usr/share/grafana/public/app/plugins/datasource/prometheus/datasource.ts shell > sed -i 's/,range_input/.replace(\/"{\/g,"\\"").replace(\/}"\/g,"\\""),range_input/; s/step_input:""/step_input:this.target.step/' /usr/share/grafana/public/app/plugins/datasource/prometheus/query_ctrl.ts
4.启动grafana
centos7
shell > systemctl enable grafana-server shell > systemctl start grafana-server shell > systemctl status grafana-servercentos6
shell > service grafana-server start5.访问grafana
可以通过http://你的IP:3000 访问grafana,默认用户名密码为:admin/admin
6.安装zabbix插件
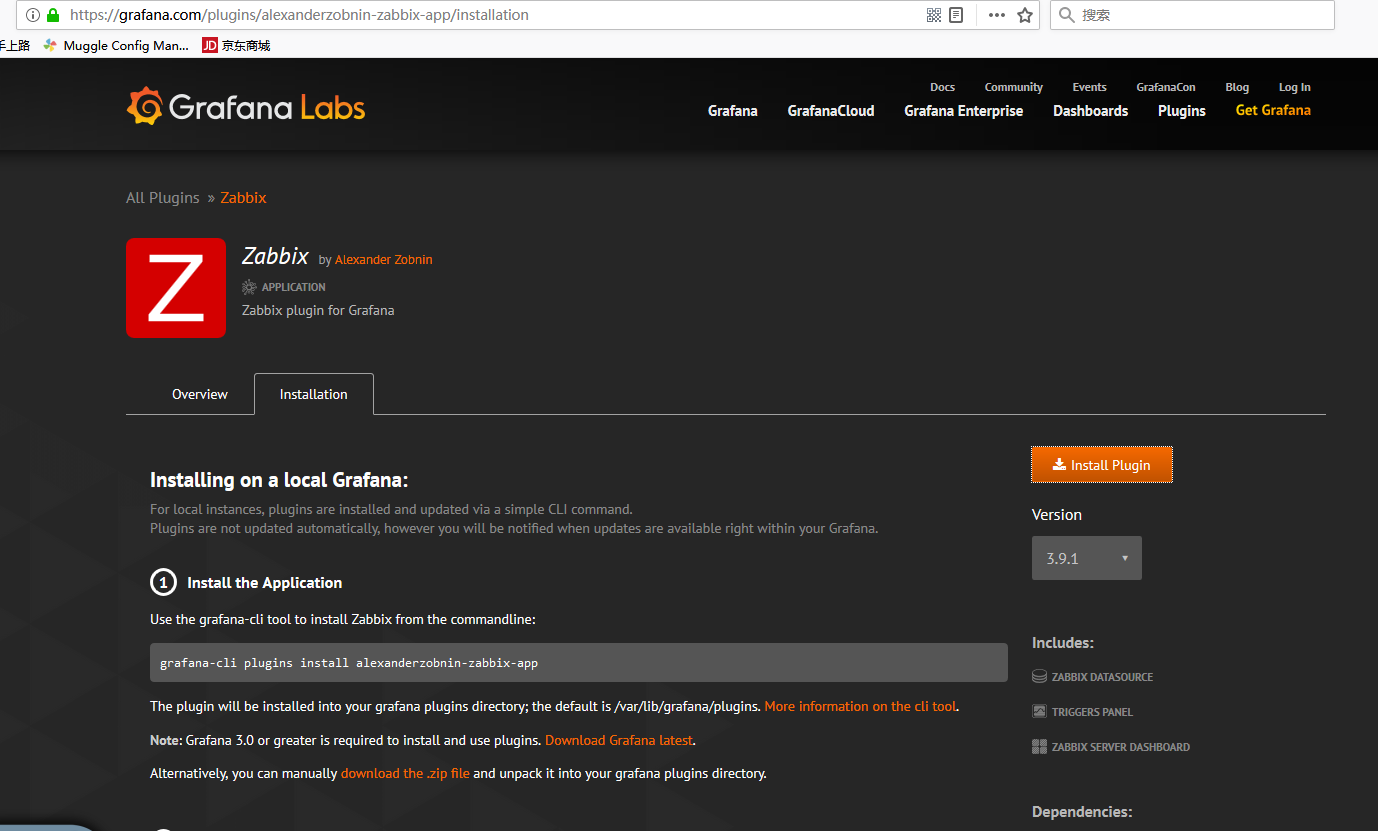
按插件中的提示安装插件
shell > grafana-cli plugins install alexanderzobnin-zabbix-app7.配置zabbix数据源
在grafana侧边栏中找到datasource进行配置,具体配置信息如下:其中url那一栏是通用的(http://你的IP/zabbix/api_jsonrpc.php)
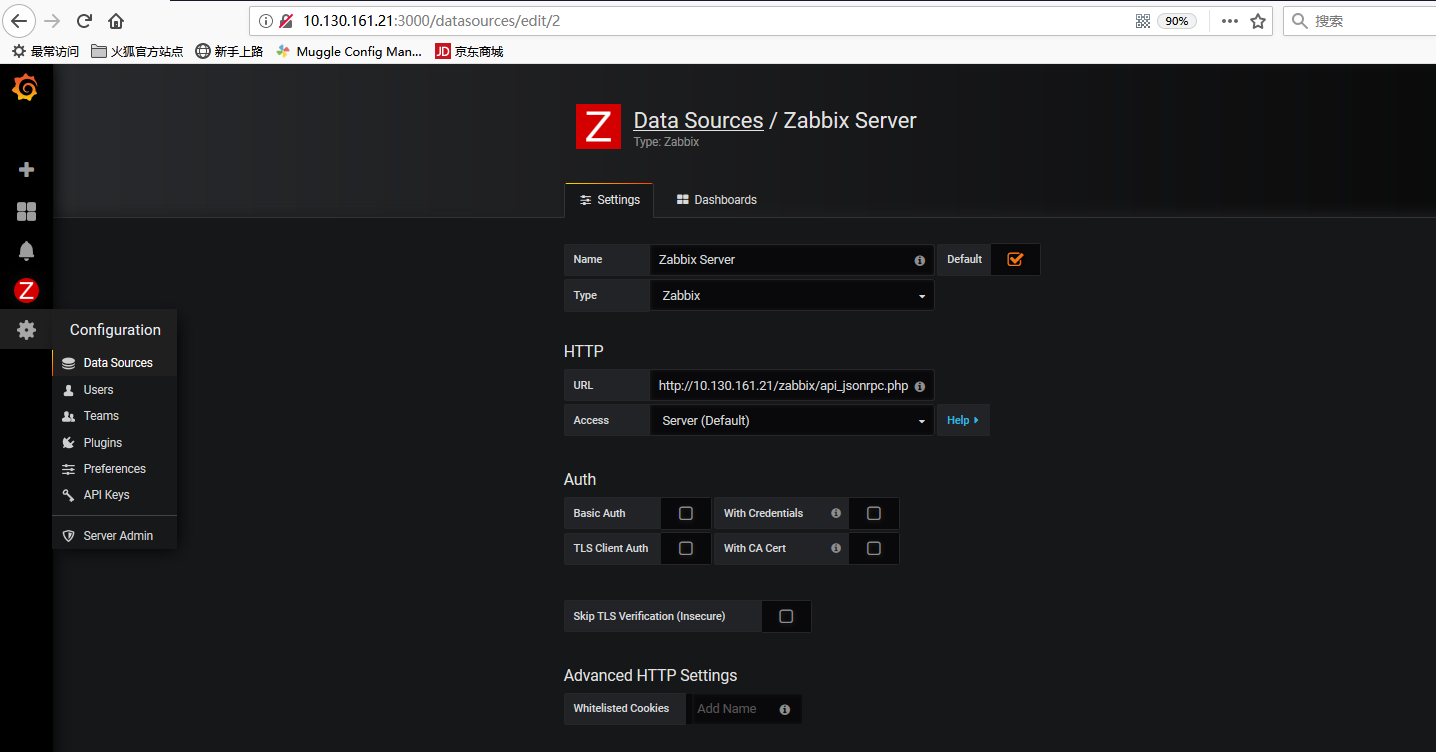
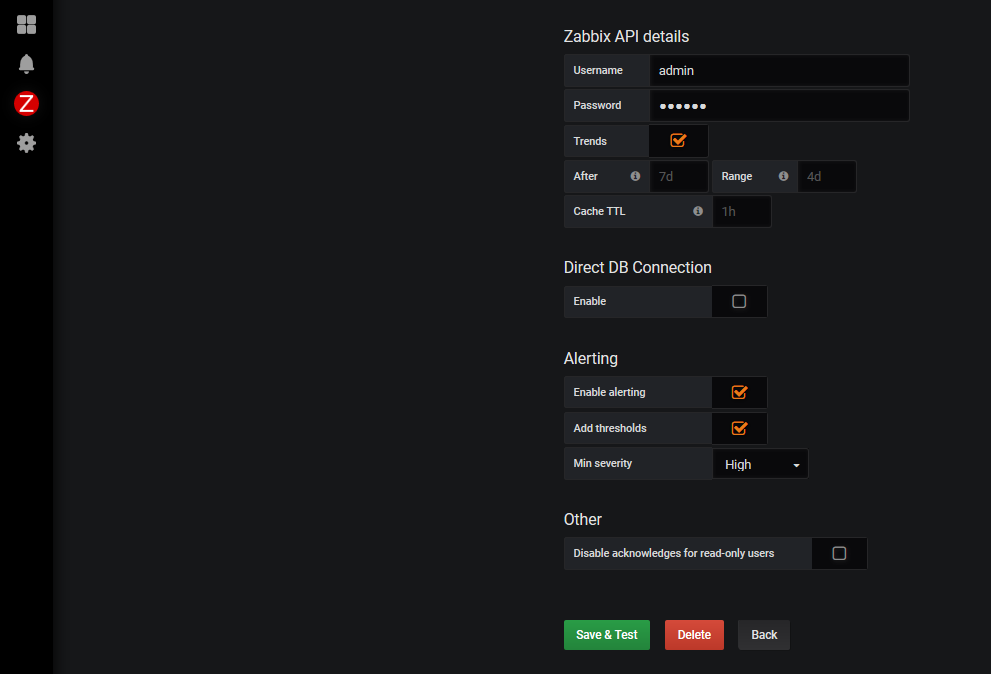
点击save & Test之后提示success表示成功
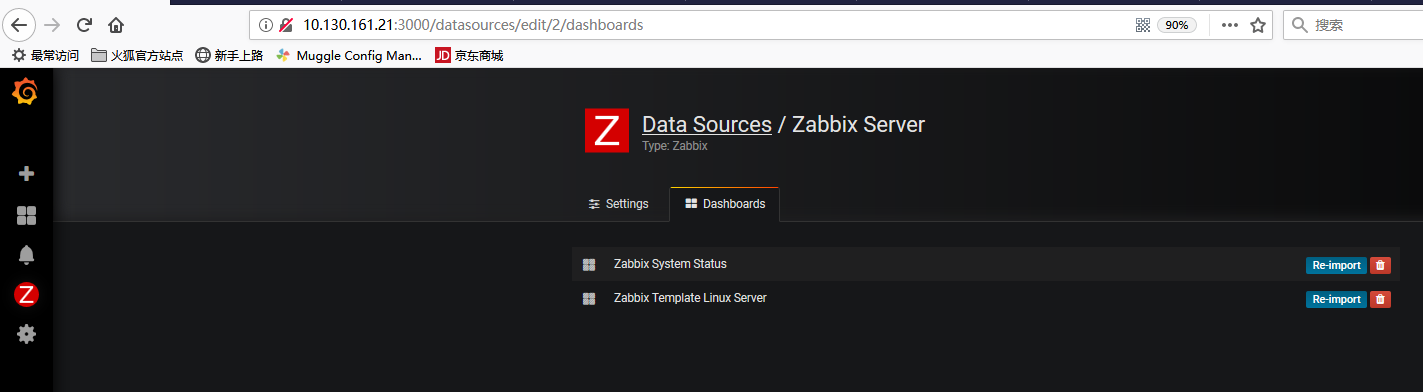
点击Settings旁边的Dashboards页签,看到两项都点击import
8.添加具体监控
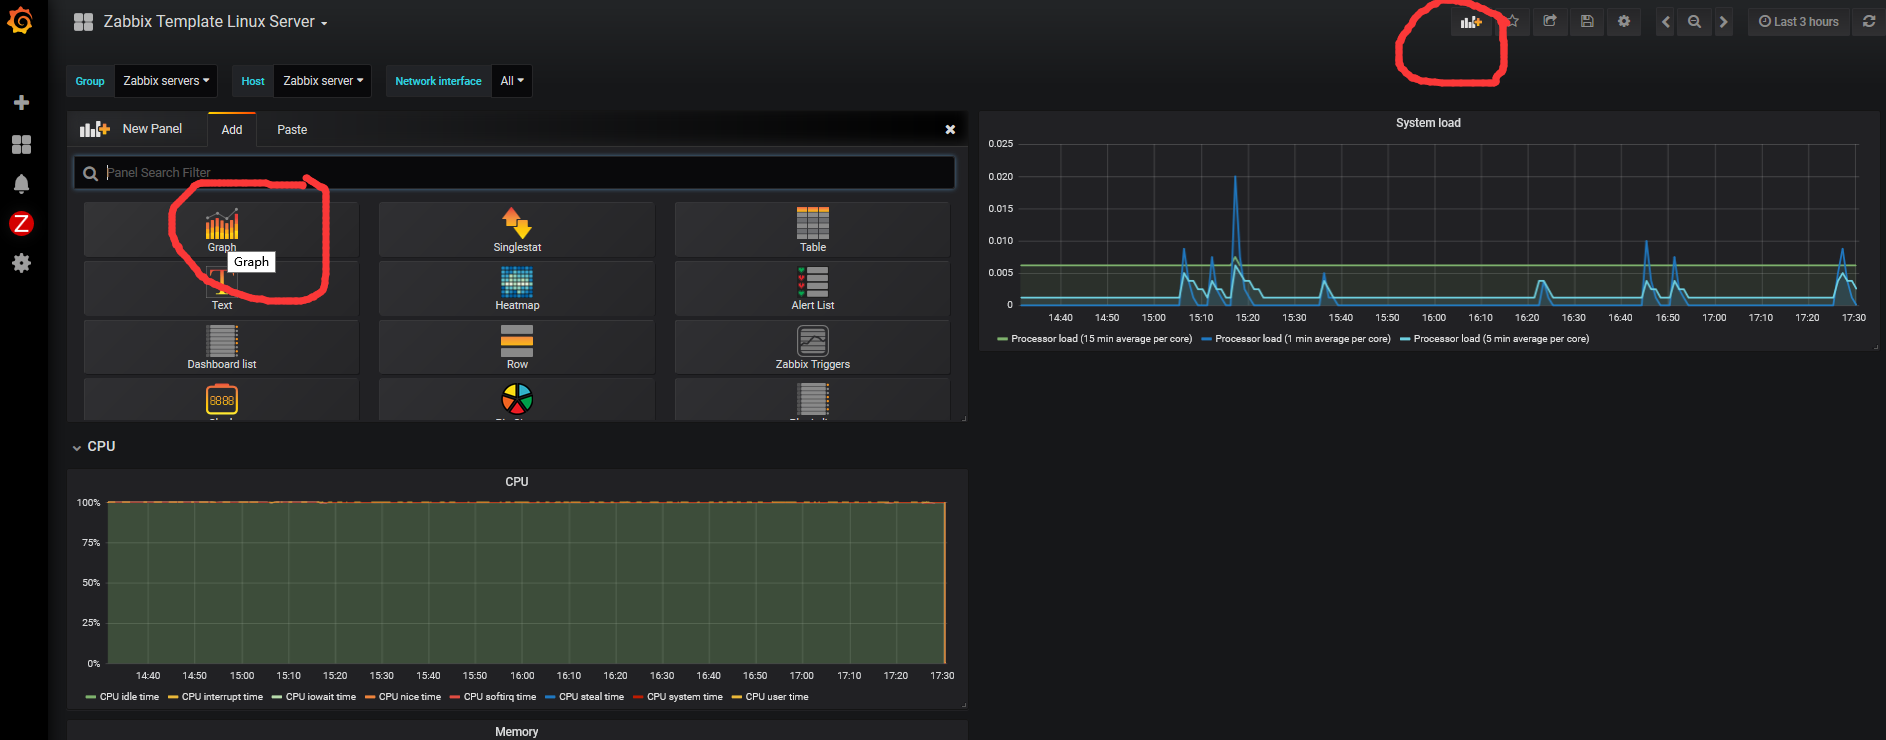
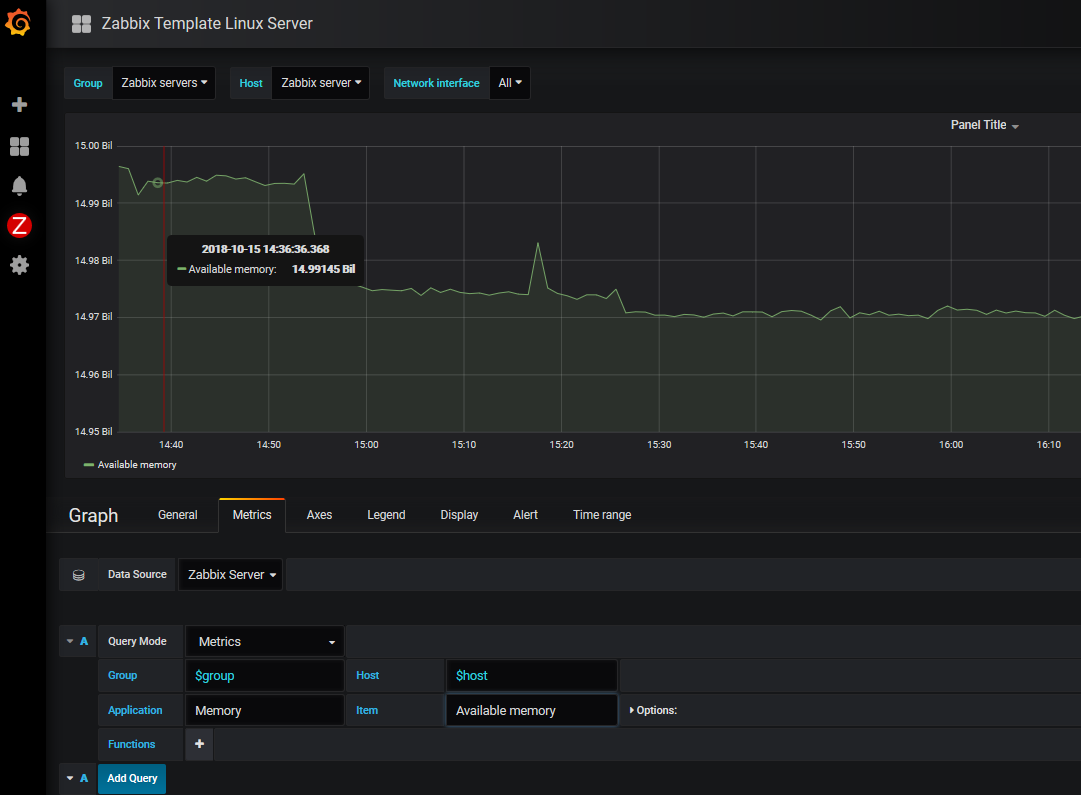
点击Dashboards页签上的Zabbix Template Linux Server,进入展示面板,里面的信息不全,我们需要通过点击Add Panel图标,来添加新的监控数据
在添加好的panel中点击标题中的Edit进点编辑
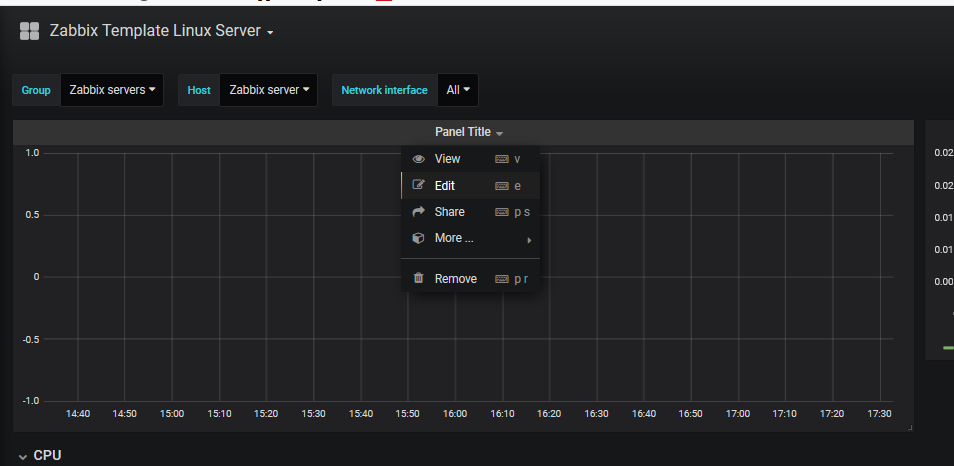
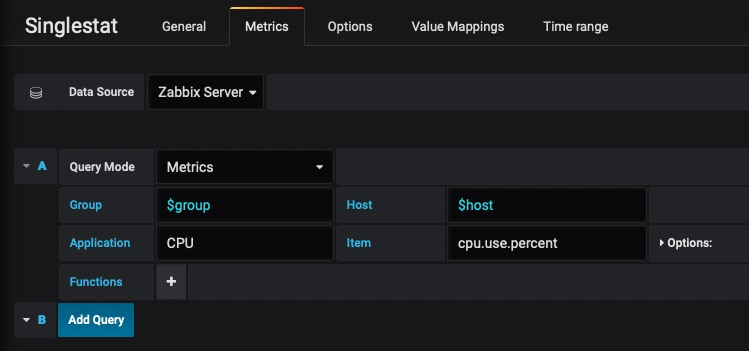
在Metrics页签中,数据源选Zabbix Server,Group选$group,Host选$host,这两项是为了自适应面板上多个服务器的监控数据,Application有下拉列表选技具体的监控项,Item里选具体的监控参数,Item里可以填正则表达式,例如:/memory/表示所有的带memory字段的监控参数;在General页签里设置标题,
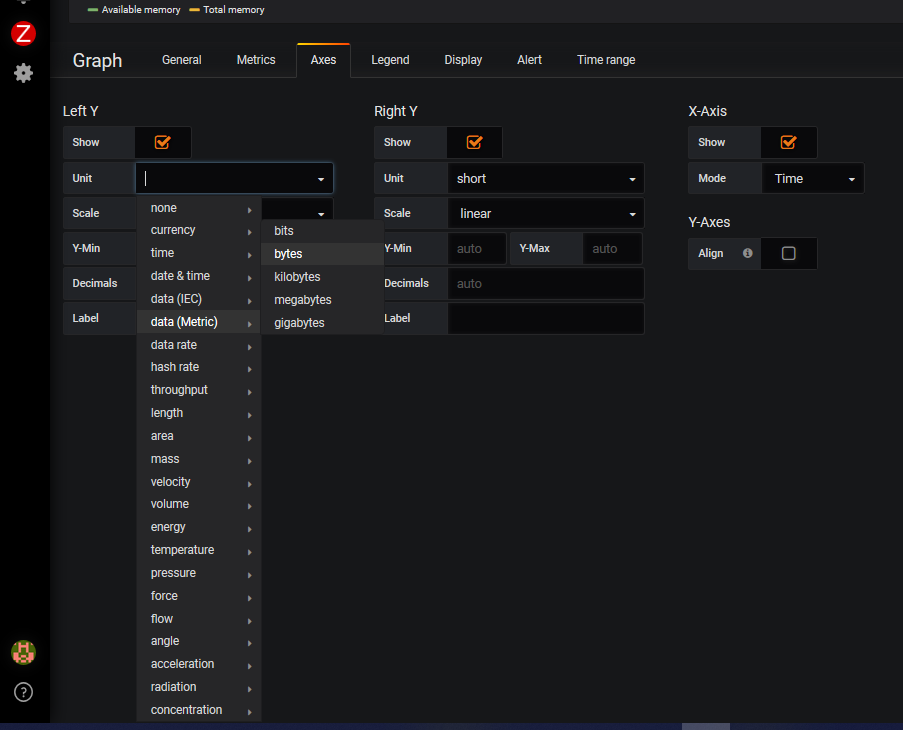
在Axes页签里设置x,y轴的参数,其中unit是设置显示的单位
都设置好后,记得点击右上角的保存图标,就大功告成了
三、配置好看的仪表盘
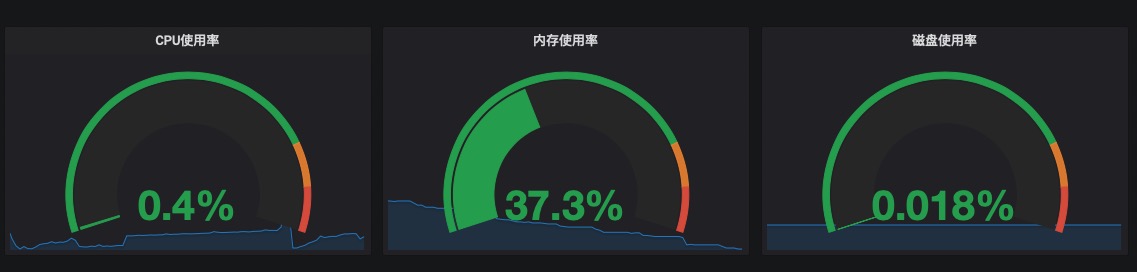
上图中的仪表盘主要是grafana中的singlestat控制板实现的
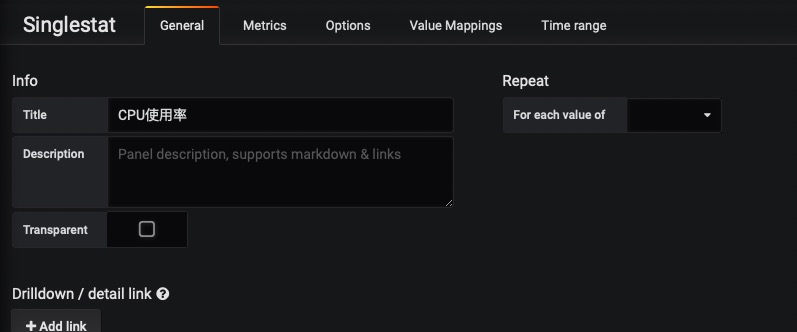
1.首先,添加singlestat面板,添加仪表板名称等
2.配置数据源(此处数据源为zabbix中自定义的数据源,之后会讲到)
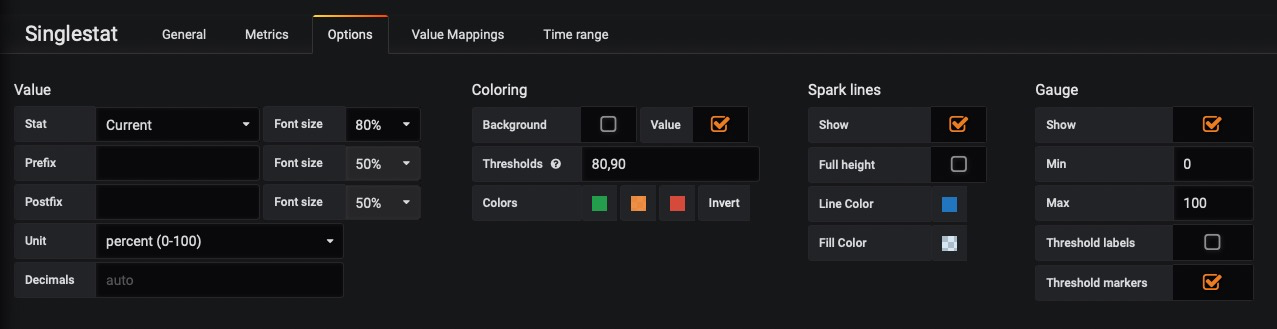
3.配置图形显示
3.文本映射
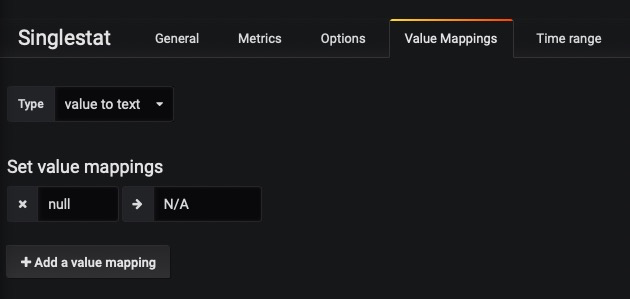
值/范围到文本映射允许您将汇总数据的值转换为显式文本,此处基本上是默认的,不需要变更
仪表板配置参考网址:https://www.jianshu.com/p/a7a9f2d02a4b
四、zabbix自定义数据源
此处主要用于cpu使用率等zabbix中没有的数据,并且只能使用现有的zabbix中提供的数据源计算获得,以cpu使用率举例:
依次选择配置-》模板-》Template OS Linux-》监控项
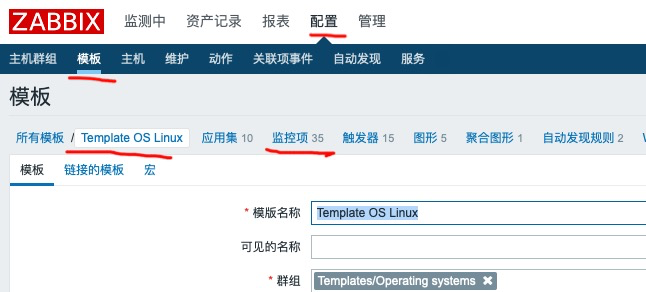
点击右上角创建监控项

下面是具体配置项
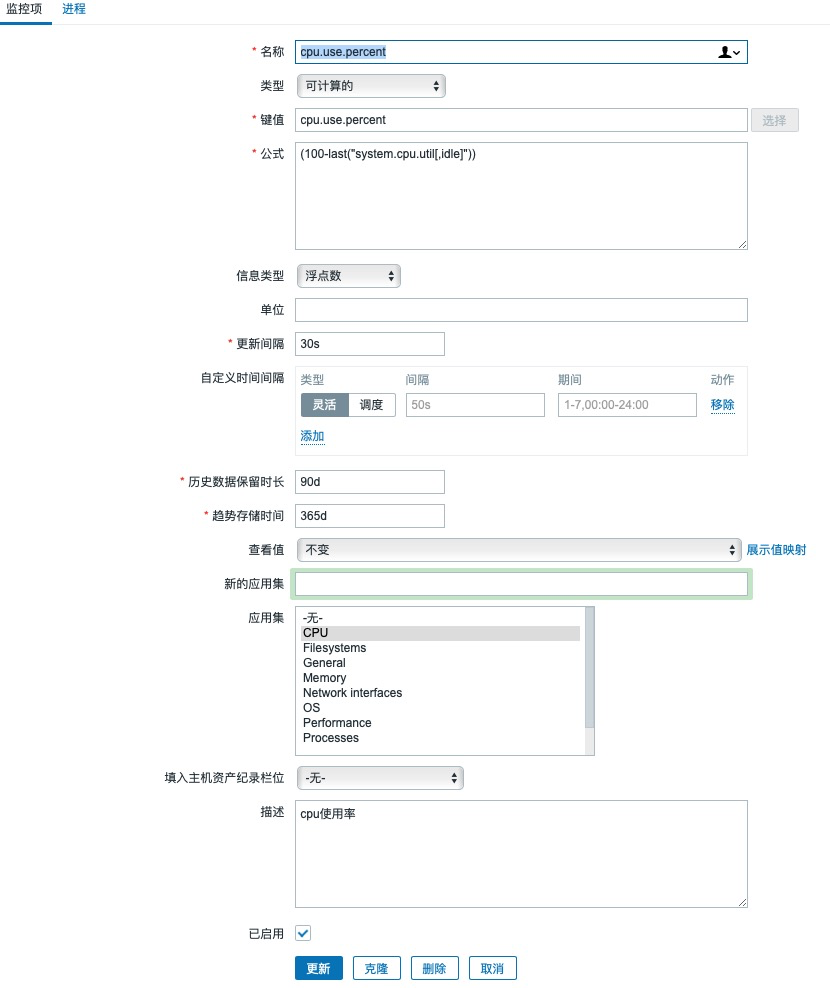
其中名称和键值就是最终在grafana数据源里选择的时候显示的名字,公式那一栏是根据其它监控项计算得出来的,例如:system.cpu.util[,idle]就是指cpu的空闲时间

公式中,last是指相应key值最后一次的监控值,公式中不能有空格
最后点击更新即可
发布者:全栈程序员-站长,转载请注明出处:https://javaforall.net/233310.html原文链接:https://javaforall.net


