
micrometer自定义metrics
micrometer提供了基于Java的monitor facade,其与springboot应用和prometheus的集成方式如下图展示
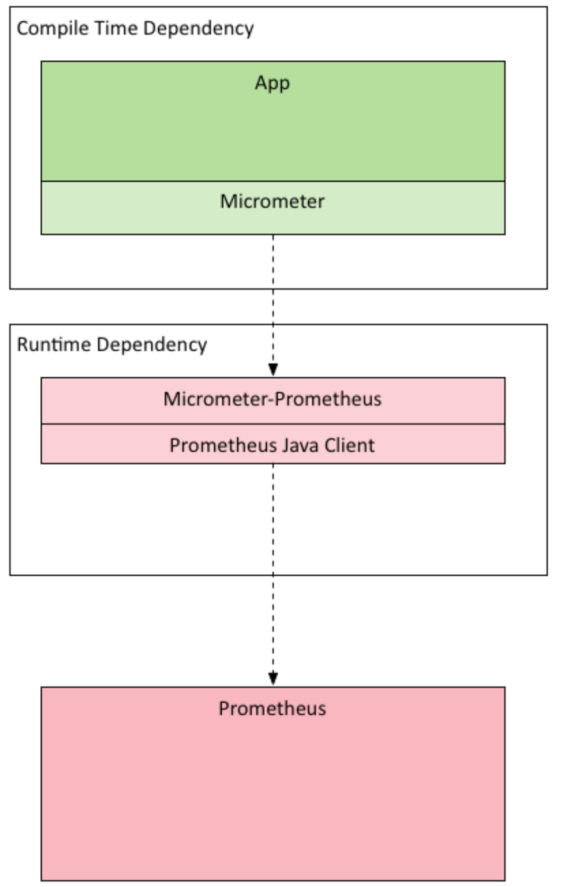

上图中展示的很清楚,应用通过micrometer采集和暴露监控端点给prometheus,prometheus通过pull模式来采集监控时序数据信息。之后作为数据源提供给grafana进行展示。
micrometer支持的度量方式及在springboot中的应用示例
Counter
Counter(计数器)简单理解就是一种只增不减的计数器。它通常用于记录服务的请求数量、完成的任务数量、错误的发生数量等等。
package com.dxz.producter.monitor; import org.springframework.stereotype.Service; import io.micrometer.core.instrument.Counter; import io.micrometer.core.instrument.Metrics; @Service("collectorService") public class CollectorService { static final Counter userCounter = Metrics.counter("user.counter.total", "services", "demo"); public void processCollectResult() throws InterruptedException { while (true) { userCounter.increment(1D); } } }Gauge
Gauge(仪表)是一个表示单个数值的度量,它可以表示任意地上下移动的数值测量。Gauge通常用于变动的测量值,如当前的内存使用情况,同时也可以测量上下移动的”计数”,比如队列中的消息数量。
package com.dxz.producter.monitor; import java.util.ArrayList; import java.util.List; import java.util.concurrent.atomic.AtomicInteger; import org.springframework.stereotype.Component; import io.micrometer.core.instrument.Gauge; import io.micrometer.core.instrument.ImmutableTag; import io.micrometer.core.instrument.Metrics; import io.micrometer.core.instrument.Tag; import io.micrometer.core.instrument.simple.SimpleMeterRegistry; @Component("passCaseMetric") public class PassCaseMetric { List<Tag> init() { ArrayList<Tag> list = new ArrayList() { }; list.add(new ImmutableTag("service", "demo")); return list; } AtomicInteger atomicInteger = new AtomicInteger(0); Gauge passCaseGuage = Gauge.builder("pass.cases.guage", atomicInteger, AtomicInteger::get).tag("service", "demo") .description("pass cases guage of demo").register(new SimpleMeterRegistry()); AtomicInteger passCases = Metrics.gauge("pass.cases.guage.value", init(), atomicInteger); public void handleMetrics() { while (true) { if (System.currentTimeMillis() % 2 == 0) { passCases.addAndGet(100); System.out.println("ADD + " + passCaseGuage.measure() + " : " + passCases); } else { int val = passCases.addAndGet(-100); if (val < 0) { passCases.set(1); } System.out.println("DECR - " + passCaseGuage.measure() + " : " + passCases); } } } }增加一个controller,触发他们:
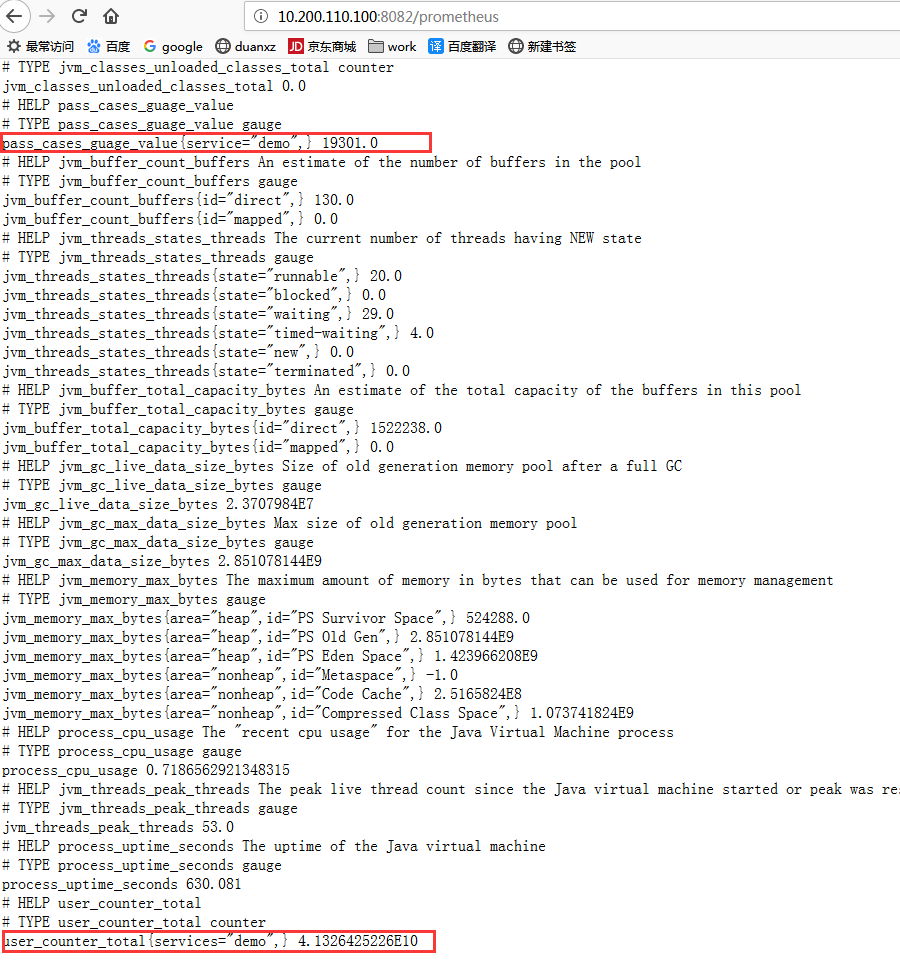
package com.dxz.producter.web; import org.springframework.beans.factory.annotation.Autowired; import org.springframework.web.bind.annotation.RequestMapping; import org.springframework.web.bind.annotation.RequestMethod; import org.springframework.web.bind.annotation.RestController; import com.dxz.producter.monitor.CollectorService; import com.dxz.producter.monitor.PassCaseMetric; @RestController @RequestMapping("/monitor") public class MonitorController { @Autowired CollectorService collectorService; @Autowired PassCaseMetric passCaseMetric; @RequestMapping(value = "/counter", method = RequestMethod.GET) public String counter() throws InterruptedException { collectorService.processCollectResult(); return "+1"; } @RequestMapping(value = "/gauge", method = RequestMethod.GET) public String gauge() throws InterruptedException { passCaseMetric.handleMetrics(); return "+gauge"; } }启动springboot应用,可以在http://host:port/actuator/prometheus 看到端点收集到的数据。其他的也是类似的不再一一截图展示。
这里使用了一个true的循环用来展示不断更新的效果。
同样的可以在grafana中看到监控展示信息
Timer
Timer(计时器)同时测量一个特定的代码逻辑块的调用(执行)速度和它的时间分布。简单来说,就是在调用结束的时间点记录整个调用块执行的总时间,适用于测量短时间执行的事件的耗时分布,例如消息队列消息的消费速率。
@Test public void testTimerSample(){ Timer timer = Timer.builder("timer") .tag("timer", "timersample") .description("timer sample test.") .register(new SimpleMeterRegistry()); for(int i=0; i<2; i++) { timer.record(() -> { try { TimeUnit.SECONDS.sleep(2); }catch (InterruptedException e){ } }); } System.out.println(timer.count()); System.out.println(timer.measure()); System.out.println(timer.totalTime(TimeUnit.SECONDS)); System.out.println(timer.mean(TimeUnit.SECONDS)); System.out.println(timer.max(TimeUnit.SECONDS)); }响应数据
2 [Measurement{statistic='COUNT', value=2.0}, Measurement{statistic='TOTAL_TIME', value=4.00}, Measurement{statistic='MAX', value=2.00}] 4.00 2.00 2.00
Summary
Summary(摘要)用于跟踪事件的分布。它类似于一个计时器,但更一般的情况是,它的大小并不一定是一段时间的测量值。在micrometer中,对应的类是DistributionSummary,它的用法有点像Timer,但是记录的值是需要直接指定,而不是通过测量一个任务的执行时间。
@Test public void testSummary(){ DistributionSummary summary = DistributionSummary.builder("summary") .tag("summary", "summarySample") .description("summary sample test") .register(new SimpleMeterRegistry()); summary.record(2D); summary.record(3D); summary.record(4D); System.out.println(summary.count()); System.out.println(summary.measure()); System.out.println(summary.max()); System.out.println(summary.mean()); System.out.println(summary.totalAmount()); }
响应数据:
3 [Measurement{statistic='COUNT', value=3.0}, Measurement{statistic='TOTAL', value=9.0}, Measurement{statistic='MAX', value=4.0}] 4.0 3.0 9.0
序
本文主要研究下如何使用自定义micrometer的metrics
实例
DemoMetrics
public class DemoMetrics implements MeterBinder { AtomicInteger count = new AtomicInteger(0); @Override public void bindTo(MeterRegistry meterRegistry) { Gauge.builder("demo.count", count, c -> c.incrementAndGet()) .tags("host", "localhost") .description("demo of custom meter binder") .register(meterRegistry); } }这里实现了MeterBinder接口的bindTo方法,将要采集的指标注册到MeterRegistry
注册
- 原始方式
new DemoMetrics().bindTo(registry);- springboot autoconfigure
@Bean public DemoMetrics demoMetrics(){ return new DemoMetrics(); }在springboot只要标注下bean,注入到spring容器后,springboot会自动注册到registry。springboot已经帮你初始化了包括UptimeMetrics等一系列metrics。详见源码解析部分。
验证
curl -i http://localhost:8080/actuator/metrics/demo.count返回实例
{ "name": "demo.count", "measurements": [ { "statistic": "VALUE", "value": 6 } ], "availableTags": [ { "tag": "host", "values": [ "localhost" ] } ] }源码解析
MetricsAutoConfiguration
spring-boot-actuator-autoconfigure-2.0.0.RELEASE-sources.jar!/org/springframework/boot/actuate/autoconfigure/metrics/MetricsAutoConfiguration.java
@Configuration @ConditionalOnClass(Timed.class) @EnableConfigurationProperties(MetricsProperties.class) @AutoConfigureBefore(CompositeMeterRegistryAutoConfiguration.class) public class MetricsAutoConfiguration { @Bean @ConditionalOnMissingBean public Clock micrometerClock() { return Clock.SYSTEM; } @Bean public static MeterRegistryPostProcessor meterRegistryPostProcessor( ApplicationContext context) { return new MeterRegistryPostProcessor(context); } @Bean @Order(0) public PropertiesMeterFilter propertiesMeterFilter(MetricsProperties properties) { return new PropertiesMeterFilter(properties); } @Configuration @ConditionalOnProperty(value = "management.metrics.binders.jvm.enabled", matchIfMissing = true) static class JvmMeterBindersConfiguration { @Bean @ConditionalOnMissingBean public JvmGcMetrics jvmGcMetrics() { return new JvmGcMetrics(); } @Bean @ConditionalOnMissingBean public JvmMemoryMetrics jvmMemoryMetrics() { return new JvmMemoryMetrics(); } @Bean @ConditionalOnMissingBean public JvmThreadMetrics jvmThreadMetrics() { return new JvmThreadMetrics(); } @Bean @ConditionalOnMissingBean public ClassLoaderMetrics classLoaderMetrics() { return new ClassLoaderMetrics(); } } @Configuration static class MeterBindersConfiguration { @Bean @ConditionalOnClass(name = { "ch.qos.logback.classic.LoggerContext", "org.slf4j.LoggerFactory" }) @Conditional(LogbackLoggingCondition.class) @ConditionalOnMissingBean(LogbackMetrics.class) @ConditionalOnProperty(value = "management.metrics.binders.logback.enabled", matchIfMissing = true) public LogbackMetrics logbackMetrics() { return new LogbackMetrics(); } @Bean @ConditionalOnProperty(value = "management.metrics.binders.uptime.enabled", matchIfMissing = true) @ConditionalOnMissingBean public UptimeMetrics uptimeMetrics() { return new UptimeMetrics(); } @Bean @ConditionalOnProperty(value = "management.metrics.binders.processor.enabled", matchIfMissing = true) @ConditionalOnMissingBean public ProcessorMetrics processorMetrics() { return new ProcessorMetrics(); } @Bean @ConditionalOnProperty(name = "management.metrics.binders.files.enabled", matchIfMissing = true) @ConditionalOnMissingBean public FileDescriptorMetrics fileDescriptorMetrics() { return new FileDescriptorMetrics(); } } static class LogbackLoggingCondition extends SpringBootCondition { @Override public ConditionOutcome getMatchOutcome(ConditionContext context, AnnotatedTypeMetadata metadata) { ILoggerFactory loggerFactory = LoggerFactory.getILoggerFactory(); ConditionMessage.Builder message = ConditionMessage .forCondition("LogbackLoggingCondition"); if (loggerFactory instanceof LoggerContext) { return ConditionOutcome.match( message.because("ILoggerFactory is a Logback LoggerContext")); } return ConditionOutcome .noMatch(message.because("ILoggerFactory is an instance of " + loggerFactory.getClass().getCanonicalName())); } } }可以看到这里注册了好多metrics,比如UptimeMetrics,JvmGcMetrics,ProcessorMetrics,FileDescriptorMetrics等
这里重点看使用@Bean标注了MeterRegistryPostProcessor
MeterRegistryPostProcessor
spring-boot-actuator-autoconfigure-2.0.0.RELEASE-sources.jar!/org/springframework/boot/actuate/autoconfigure/metrics/MeterRegistryPostProcessor.java
class MeterRegistryPostProcessor implements BeanPostProcessor { private final ApplicationContext context; private volatile MeterRegistryConfigurer configurer; MeterRegistryPostProcessor(ApplicationContext context) { this.context = context; } @Override public Object postProcessAfterInitialization(Object bean, String beanName) throws BeansException { if (bean instanceof MeterRegistry) { getConfigurer().configure((MeterRegistry) bean); } return bean; } @SuppressWarnings("unchecked") private MeterRegistryConfigurer getConfigurer() { if (this.configurer == null) { this.configurer = new MeterRegistryConfigurer(beansOfType(MeterBinder.class), beansOfType(MeterFilter.class), (Collection<MeterRegistryCustomizer<?>>) (Object) beansOfType( MeterRegistryCustomizer.class), this.context.getBean(MetricsProperties.class).isUseGlobalRegistry()); } return this.configurer; } private <T> Collection<T> beansOfType(Class<T> type) { return this.context.getBeansOfType(type).values(); } }可以看到这里new了一个MeterRegistryConfigurer,重点注意这里使用beansOfType(MeterBinder.class)方法的返回值给其构造器
MeterRegistryConfigurer
spring-boot-actuator-autoconfigure-2.0.0.RELEASE-sources.jar!/org/springframework/boot/actuate/autoconfigure/metrics/MeterRegistryConfigurer.java
class MeterRegistryConfigurer { private final Collection<MeterRegistryCustomizer<?>> customizers; private final Collection<MeterFilter> filters; private final Collection<MeterBinder> binders; private final boolean addToGlobalRegistry; MeterRegistryConfigurer(Collection<MeterBinder> binders, Collection<MeterFilter> filters, Collection<MeterRegistryCustomizer<?>> customizers, boolean addToGlobalRegistry) { this.binders = (binders != null ? binders : Collections.emptyList()); this.filters = (filters != null ? filters : Collections.emptyList()); this.customizers = (customizers != null ? customizers : Collections.emptyList()); this.addToGlobalRegistry = addToGlobalRegistry; } void configure(MeterRegistry registry) { if (registry instanceof CompositeMeterRegistry) { return; } // Customizers must be applied before binders, as they may add custom // tags or alter timer or summary configuration. customize(registry); addFilters(registry); addBinders(registry); if (this.addToGlobalRegistry && registry != Metrics.globalRegistry) { Metrics.addRegistry(registry); } } @SuppressWarnings("unchecked") private void customize(MeterRegistry registry) { LambdaSafe.callbacks(MeterRegistryCustomizer.class, this.customizers, registry) .withLogger(MeterRegistryConfigurer.class) .invoke((customizer) -> customizer.customize(registry)); } private void addFilters(MeterRegistry registry) { this.filters.forEach(registry.config()::meterFilter); } private void addBinders(MeterRegistry registry) { this.binders.forEach((binder) -> binder.bindTo(registry)); } }可以看到configure方法里头调用了addBinders,也就是把托管给spring容器的MeterBinder实例bindTo到meterRegistry
小结
springboot2引入的micrometer,自定义metrics只需要实现MeterBinder接口,然后托管给spring即可,springboot的autoconfigure帮你自动注册到meterRegistry。
发布者:全栈程序员-站长,转载请注明出处:https://javaforall.net/233457.html原文链接:https://javaforall.net


