
大家好,又见面了,我是你们的朋友全栈君。
数据可视化前言:https://blog.csdn.net/diviner_s/article/details/115933789
Apache Echarts简介:https://blog.csdn.net/diviner_s/article/details/115934089
项目最终效果图:
此篇博客为自己学习pink老师的课后完成的项目的总结与记录,仅供交流参考。版权所有,转载请标注原作者!
使用echarts技术做的可视图,此外其项目包含 的技术有html、css、js、jquerry、ajax、websocket、koa等。

写到这里我们的系列文也到了前端最后一个界面,做左侧第一个柱状图跳转子界面。
预告:下一篇开始就我们将前后端进行分离以及实现前后端交互。
实现数据动态获取
目的是使用同一个界面图表模板,通过点击不同的元素实现传输对应的不同数据进行展示。
左侧跳转界面不同数据展示


右侧跳转界面不同数据展示

cookie存储信息
Cookie 用于存储 web 页面的用户信息。在这里我们用cookie存储首页面点击柱状图元素下标
如上图,我们继续看针对左上柱状图的每个柱状体都对应着不同下标,因此我们使用cookie暂时存储下标。
cookie创建
-
创建cookie:
document.cookie = params.dataIndex默认情况下,cookie 在浏览器关闭时删除。
我们现在首页左上柱状图试验一下:
这段代码位置:
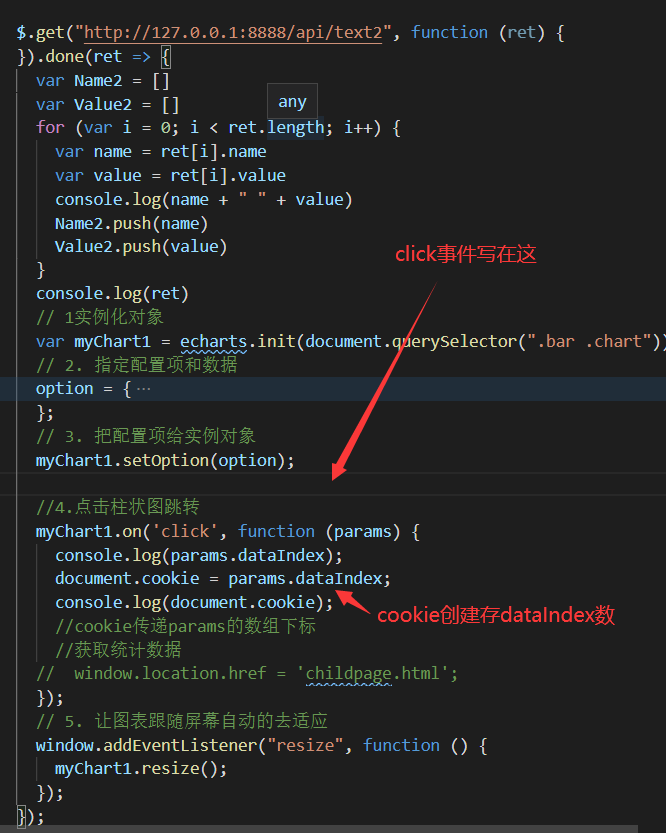
我们使用如下代码,打印获取的dataIndex和cookie值://4.点击柱状图跳转 myChart1.on('click', function (params) { console.log('dataIndex: ' + params.dataIndex); document.cookie = params.dataIndex; console.log('cookie: ' + document.cookie); //cookie传递params的数组下标 //获取统计数据 //先将跳转界面注释掉 // window.location.href = 'childpage.html'; });
点击不同柱体打印的就是不同cookie值,看右侧打印情况:

因此我们已经将对应index存入cookie,接下来就是读取cookie。
cookie读取
在 JavaScript 中, 可以使用var x = document.cookie来读取 cookie。
注意:document.cookie 将以字符串的方式返回所有的 cookie,类型格式: cookie1=value; cookie2=value; cookie3=value;
返回格式是字符串+;返回,因此我们使用分隔符取“‘;”前的数。
var jsonstr = document.cookie.split(';')[0];

子页面一
跳转动画展示

子页面展示

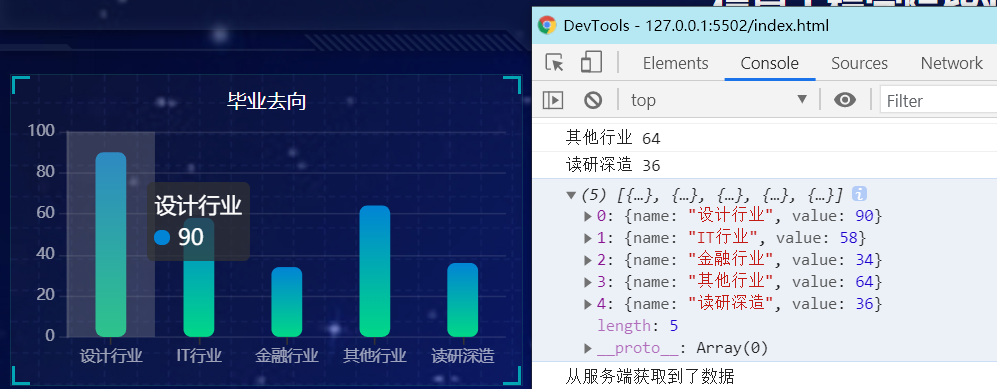
子页面给出两个图表,分别是关于行业分布的柱状图和关于行业班级比例的扇形图。
纵向柱状图
图表还不会配置的来这里!,后面直接放代码。
数据来源:采用Ajax的get(url,function())请求获取数据
这里需要注意的是:function是回调函数需要获取数据后存放在ret后,在done中进行数据的解析。
(function () {

	// 使用cookie存点击的数据
  var jsonstr = document.cookie.split(';')[0];

  console.log("cookie:" + jsonstr);

  //ajax的get请求获取数据
  $.get("data/case0", function (ret, status) {


    var job = []
    var number = []
    console.log("data长度:" + ret[jsonstr].length)
    console.log(ret)
    var maxn = 0;
    for (var i = 0; i < ret[jsonstr].length; i++) {

      var name = ret[jsonstr][i].name
      var num = ret[jsonstr][i].number
      if (maxn < num) maxn = num
      console.log(name + " " + num + " ==== ")
      job.push(name)
      number.push(num)
    }
    // console.log(job)
    // console.log(number)

    var mCharts1 = echarts.init(document.getElementById("div1"))
    option1 = {

      grid: {
    containLabel: true },
      xAxis: {

        type: 'value',
        axisLabel: {

          color: '#fff',
          fontSize: "15"
        },
        axisLine: {

          lineStyle: {

            type: 'solid',
            color: '#fff',//左边线的颜色
            //width:'1'
          }
        }
      },
      yAxis: {

        name: '职业',
        type: 'category',
        axisLabel: {

          //color: "rgba(255,255,255,.6) ",
          color: '#fff',
          fontSize: "20"
        },
        axisLine: {

          lineStyle: {

            type: 'solid',
            color: '#fff',//左边线的颜色
            //width:'1'
          }
        },
        data: job,
      },
      visualMap: {
    //控制颜色渐变
        orient: ' ',
        left: 'center',
        min: 1,
        max: maxn,
        textStyle: {

          fontSize: 20,
          color: '#fff'
        },
        text: ['', '就业人数:'],
        // Map the score column to color
        dimension: 0,
        inRange: {

          color: ['#65B581', '#FFCE34', '#FD665F']
        }
      },

      series: [{

        data: number,
        type: 'bar',
        barWidth: "50%",
        label: {

          show: false
        },
        itemStyle: {

          // 修改柱子圆角
          barBorderRadius: 10
        }
      }],
    };

    mCharts1.setOption(option1)

  });
})();
环形图
(function () {

  var jsonstr = document.cookie.split(';')[0];

  //console.log("cookie2:" + jsonstr);

  $.get("http://127.0.0.1:8888/api/banjibili", function (ret, status) {


    console.log(ret)
    console.log(ret[jsonstr])
    var mCharts2 = echarts.init(document.getElementById("div2"))
    option2 = {

      tooltip: {

        trigger: 'item',
        formatter: '{b} : {c} ({d}%)'
      },
      color: [
        "#FE642E",
        "#FE9A2E",
        "#F4FA58",
        "#ACFA58",
        "#01DFD7",
        "#0096ff",
        "#8258FA",
        "#FE2E9A"
      ],
      legend: {

        top: "bottom",
        left: "center",
        //bottom: '0',
        textStyle: {

          color: '#fff',
          fontSize: 18
        }
      },
      series: [
        {

          type: 'pie',
          radius: ['40%', '70%'],
          avoidLabelOverlap: false,
          label: {

            show: false,
            position: 'center',
          },
          emphasis: {

            label: {

              show: true,
              fontSize: '30',
              fontWeight: 'bold'
            }
          },
          labelLine: {

            show: false
          },
          data: ret[jsonstr]
        }
      ]
    };
    mCharts2.setOption(option2);

    /*******高亮显示开始**********/
    var _this2 = this
    var isSet2 = true // 为了做判断:当鼠标移动上去的时候,自动高亮就被取消
    var currentIndex2 = 0

    // 2、鼠标移动上去的时候的高亮动画
    mCharts2.on('mouseover', function (param) {

      isSet2 = false
      clearInterval(_this2.startCharts)
      // 取消之前高亮的图形
      mCharts2.dispatchAction({

        type: 'downplay',
        seriesIndex: 0,
        dataIndex: currentIndex2
      })
      // 高亮当前图形
      mCharts2.dispatchAction({

        type: 'highlight',
        seriesIndex: 0,
        dataIndex: param.dataIndex
      })
      // 显示 tooltip
      mCharts2.dispatchAction({

        type: 'showTip',
        seriesIndex: 0,
        dataIndex: param.dataIndex
      })
    })
    // 3、自动高亮展示
    chartHover = function () {

      var dataLen = mCharts2.getOption().series[0].data.length //计算总的数组长度
      // 取消之前高亮的图形
      mCharts2.dispatchAction({

        type: 'downplay',
        seriesIndex: 0,
        dataIndex: currentIndex2
      })
      currentIndex2 = (currentIndex2 + 1) % dataLen
      // 高亮当前图形
      mCharts2.dispatchAction({

        type: 'highlight',
        seriesIndex: 0,
        dataIndex: currentIndex2
      })
      // 显示 tooltip
      mCharts2.dispatchAction({

        type: 'showTip',
        seriesIndex: 0,
        dataIndex: currentIndex2
      })
    }
    _this2.startCharts = setInterval(chartHover, 1000)
    // 4、鼠标移出之后,恢复自动高亮
    mCharts2.on('mouseout', function (param) {

      if (!isSet2) {

        _this2.startCharts = setInterval(chartHover, 1000)
        isSet2 = true
      }
    })
    /*******高亮显示结束**********/


  });
})();
子页面二
跳转动画展示

子页面展示

柱状图
(function () {

  //不同就业去向
  var jsonstr = document.cookie.split(';')[0];
  console.log("cookie:" + jsonstr);
  $.get("http://127.0.0.1:8888/api/nannv", function (ret, status) {


    var data1 = ret[jsonstr].data;
    var myChart = echarts.init(document.getElementById("div1"));
    var option = {

      legend: {

        bottom: "0%",
        textStyle: {

          color: "write"
        }
      },
      tooltip: {
   },
      dataset: {

        dimensions: ['product', '男', '女'],
        source: data1
      },

      xAxis: {

        type: 'category',
        axisLabel: {

          color: '#fff',
          fontSize: "20"
        },
        axisLine: {

          lineStyle: {

            type: 'solid',
            color: '#fff',
          }
        },
      },
      yAxis: {

        name: "人数",
        axisLabel: {

          color: '#fff',
          fontSize: "20"
        },
        axisLine: {

          lineStyle: {

            type: 'solid',
            color: '#fff',
          }
        },
      },
      barWidth: "30%",
      series: [
        {

          type: 'bar', itemStyle: {

            color: new echarts.graphic.LinearGradient(0, 0, 0, 1, [{

              offset: 0,
              color: 'rgba(0, 221, 255)'
            }, {

              offset: 1,
              color: 'rgba(77, 119, 255)'
            }])
          },
          label: {

            show: true,
            position: 'top',
            color: "white",
            fontSize: 20
          },
          barGap: "20%"
        },
        {

          type: 'bar', color: new echarts.graphic.LinearGradient(0, 0, 0, 1, [{

            offset: 0,
            color: 'rgba(255, 0, 135)'
          }, {

            offset: 1,
            color: 'rgba(135, 0, 157)'
          }]),
          label: {

            show: true,
            position: 'top',
            color: "white",
            fontSize: 20
          },
        },

      ]
    };
    myChart.setOption(option);
  })
})();
饼图
(function () {

  //班级男生人数
  var jsonstr = document.cookie.split(';')[0];
  $.get("http://127.0.0.1:8888/api/nannv", function (ret, status) {

    var data1 = ret[jsonstr].nan;
    //班级女生人数
    var data2 = ret[jsonstr].nv;
    var myChart = echarts.init(document.getElementById('div2'));
    var option;
    option = {

      tooltip: {

        trigger: 'item',
        formatter: function (params) {

          // do some thing
          console.log(params)
          return params.name + ":" + params.value + "人"
        }
      },
      // legend: {

      // orient: 'vertical',
      // left: 'left',
      // bottom: "0%",
      // itemWidth: 30,
      // itemHeight: 30,
      // textStyle: {

      // color: "write"
      // }
      // },
      series: [
        {

          type: 'pie',
          radius: '60%',
          itemStyle: {

            normal: {

              label: {

                fontSize: 20,
                show: true,
                position: [0, -20],
                color: '#ddd',
                formatter: function (params) {

                  var percent = 0;
                  var total = 0;
                  total += data1 + data2;
                  percent = ((params.value / total) * 100).toFixed(0);
                  if (params.name !== '') {

                    return params.name + ':' + percent + '%';
                  } else {

                    return '';
                  }
                },
              },
              labelLine: {

                length: 15,
                length2: 10,
                show: true,
                color: '#00ffff',
              },
            },
          },

          data: [
            {

              value: data1, name: '男',
              itemStyle: {

                color: new echarts.graphic.LinearGradient(0, 0, 0, 1, [{

                  offset: 0,
                  color: 'rgba(0, 221, 255)'
                }, {

                  offset: 1,
                  color: 'rgba(77, 119, 255)'
                }])
              }
            },
            {

              value: data2, name: '女',
              itemStyle: {

                color: new echarts.graphic.LinearGradient(0, 0, 0, 1, [{

                  offset: 0,
                  color: 'rgba(255, 0, 135)'
                }, {

                  offset: 1,
                  color: 'rgba(135, 0, 157)'
                }])
              }
            }
          ],
          emphasis: {

            itemStyle: {

              shadowBlur: 10,
              shadowOffsetX: 0,
              shadowColor: 'rgba(0, 0, 0, 0.5)'
            }
          }
        }
      ]
    };
    myChart.setOption(option)

  })
})()
CSS界面布局
两个子界面使用的同一个CSS布局
* {

  margin: 0;
  padding: 0;
  box-sizing: border-box;
}
li {

  list-style: none;
}
/* 声明字体*/
@font-face {

  font-family: electronicFont;
  src: url(../font/DS-DIGIT.TTF);
}
body {

  background: url(../images/bg.jpg) no-repeat top center;
  line-height: 1.15;
  overflow:hidden;
}
header {

  position: relative;
  height: 1.25rem;
  background: url(../images/head_bg.png) no-repeat;
  background-size: 100% 100%;
}
header h1 {

  font-size: 0.475rem;
  color: #fff;
  text-align: center;
  line-height: 1rem;
}
header .showTime {

  position: absolute;
  right: 0.375rem;
  top: 0;
  line-height: 0.9375rem;
  color: rgba(255, 255, 255, 0.7);
  font-size: 0.25rem;
}
.mainbox {

  display: flex;
  min-width: 1024px;
  max-width: 1920px;
  margin: 0 auto;
  padding: 1.4rem 0.125rem 0;
}
.mainbox .column {

  flex: 5;
}
.mainbox .column:nth-child(2) {

  flex: 3;
  margin: 0 0.125rem 0.1875rem;
  overflow: hidden;
}
.mainbox .panel {

  position: relative;
  height: 9rem;
  padding: 0 0.1875rem 0.1rem 0.5rem;
  border: 1px solid rgba(25, 186, 139, 0.17);
  margin-bottom: 0.1875rem;
  background: url(../images/line.png) rgba(255, 255, 255, 0.03);
}
.mainbox .panel::before {

  position: absolute;
  top: 0;
  left: 0;
  width: 10px;
  height: 10px;
  border-left: 2px solid #02a6b5;
  border-top: 2px solid #02a6b5;
  content: "";
}
.mainbox .panel::after {

  position: absolute;
  top: 0;
  right: 0;
  width: 10px;
  height: 10px;
  border-right: 2px solid #02a6b5;
  border-top: 2px solid #02a6b5;
  content: "";
}
.mainbox .panel .panel-footer {

  position: absolute;
  bottom: 0;
  left: 0;
  width: 100%;
}
.mainbox .panel .panel-footer::before {

  position: absolute;
  left: 0;
  bottom: 0;
  width: 10px;
  height: 10px;
  border-left: 2px solid #02a6b5;
  border-bottom: 2px solid #02a6b5;
  content: "";
}
.mainbox .panel .panel-footer::after {

  position: absolute;
  bottom: 0;
  right: 0;
  width: 10px;
  height: 10px;
  border-right: 2px solid #02a6b5;
  border-bottom: 2px solid #02a6b5;
  content: "";
}
.mainbox .panel h2 {

  height: 0.6rem;
  color: #fff;
  line-height: 1.6rem;
  text-align: center;
  font-size: 0.45rem;
  font-weight: 400;
}

.mainbox .panel .chart {

  height: 8rem;
}
有不懂的可以私聊我,有需要echarts.js、jQuery.js、echarts-gl.js开源库。
评论区留下邮箱,我看到都会发给你的。
项目源码我放在我的分享的资源里了,需要请自取
发布者:全栈程序员-站长,转载请注明出处:https://javaforall.net/142432.html原文链接:https://javaforall.net


