
大家好,又见面了,我是你们的朋友全栈君。
点击上方“方志朋”,选择“设为星标”
回复”666“获取新整理的面试文章


Prometheus 是一套开源的系统监控报警框架。它由工作在 SoundCloud 的 员工创建,并在 2015 年正式发布的开源项目。2016 年,Prometheus 正式加入 Cloud Native Computing Foundation,非常的受欢迎。
简介
Prometheus 具有以下特点:
一个多维数据模型,其中包含通过度量标准名称和键/值对标识的时间序列数据
PromQL,一种灵活的查询语言,可利用此维度
不依赖分布式存储;单服务器节点是自治的
时间序列收集通过HTTP上的拉模型进行
通过中间网关支持推送时间序列
通过服务发现或静态配置发现目标
多种图形和仪表板支持模式
Prometheus 组成及架构
声明:该小节参考了文章[Prometheus 入门与实践]
Prometheus 生态圈中包含了多个组件,其中许多组件是可选的:
Prometheus Server: 用于收集和存储时间序列数据。
Client Library: 客户端库,为需要监控的服务生成相应的 metrics 并暴露给 Prometheus server。当 Prometheus server 来 pull 时,直接返回实时状态的 metrics。
Push Gateway: 主要用于短期的 jobs。由于这类 jobs 存在时间较短,可能在 Prometheus 来 pull 之前就消失了。为此,这次 jobs 可以直接向 Prometheus server 端推送它们的 metrics。这种方式主要用于服务层面的 metrics,对于机器层面的 metrices,需要使用 node exporter。
Exporters: 用于暴露已有的第三方服务的 metrics 给 Prometheus。
Alertmanager: 从 Prometheus server 端接收到 alerts 后,会进行去除重复数据,分组,并路由到对收的接受方式,发出报警。常见的接收方式有:电子邮件,pagerduty,OpsGenie, webhook 等。
一些其他的工具。
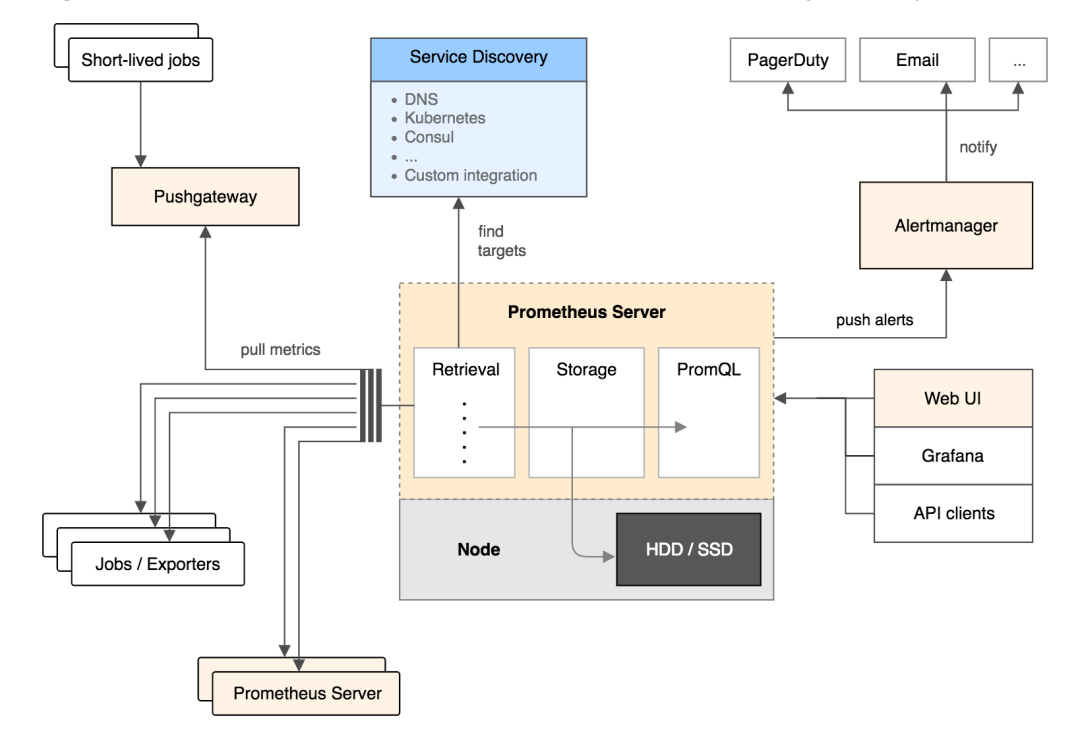
其大概的工作流程是:
Prometheus server 定期从配置好的 jobs 或者 exporters 中拉 metrics,或者接收来自 Pushgateway 发过来的 metrics,或者从其他的 Prometheus server 中拉 metrics。
Prometheus server 在本地存储收集到的 metrics,并运行已定义好的 alert.rules,记录新的时间序列或者向 Alertmanager 推送警报。
Alertmanager 根据配置文件,对接收到的警报进行处理,发出告警。
在图形界面中,可视化采集数据。
springboot 集成prometheus
在spring boot工程中引入actuator的起步依赖,以及micrometer-registry-prometheus的依赖。
org.springframework.boot
spring-boot-starter-web
org.springframework.boot
spring-boot-starter-actuator
io.micrometer
micrometer-registry-prometheus
暴露prometheus的接口;暴露metrics.tags,和spring.application.name一致。
server:
port: 8081
spring:
application:
name: my-prometheus
management:
endpoints:
web:
exposure:
include: ‘prometheus’
metrics:
tags:
application: ${spring.application.name}
写一个API接口,用作测试。代码如下:
@RestController
public class TestController {
Logger logger = LoggerFactory.getLogger(TestController.class);
@GetMapping(“/test”)
public String test() {
logger.info(“test”);
return “ok”;
}
@GetMapping(“”)
public String home() {
logger.info(“home”);
return “ok”;
}
}
在浏览器上访问http://localhost:8081/actuator/prometheus,展示的信息如下,这些信息都是actuator的一些监控信息。
# HELP jvm_gc_max_data_size_bytes Max size of old generation memory pool
# TYPE jvm_gc_max_data_size_bytes gauge
jvm_gc_max_data_size_bytes{application=”my-prometheus”,} 2.863661056E9
# HELP http_server_requests_seconds
# TYPE http_server_requests_seconds summary
http_server_requests_seconds_count{application=”my-prometheus”,exception=”None”,method=”GET”,outcome=”CLIENT_ERROR”,status=”404″,uri=”/**”,} 1.0
http_server_requests_seconds_sum{application=”my-prometheus”,exception=”None”,method=”GET”,outcome=”CLIENT_ERROR”,status=”404″,uri=”/**”,} 0.018082327
# HELP http_server_requests_seconds_max
# TYPE http_server_requests_seconds_max gauge
http_server_requests_seconds_max{application=”my-prometheus”,exception=”None”,method=”GET”,outcome=”CLIENT_ERROR”,status=”404″,uri=”/**”,} 0.018082327
# HELP jvm_threads_states_threads The current number of threads having NEW state
# TYPE jvm_threads_states_threads gauge
jvm_threads_states_threads{application=”my-prometheus”,state=”waiting”,} 12.0
jvm_threads_states_threads{application=”my-prometheus”,state=”runnable”,} 8.0
jvm_threads_states_threads{application=”my-prometheus”,state=”timed-waiting”,} 2.0
jvm_threads_states_threads{application=”my-prometheus”,state=”terminated”,} 0.0
jvm_threads_states_threads{application=”my-prometheus”,state=”blocked”,} 0.0
jvm_threads_states_threads{application=”my-prometheus”,state=”new”,} 0.0
# HELP process_files_open_files The open file descriptor count
# TYPE process_files_open_files gauge
…省略更多
安装Prometheus
安装Prometheus很简单,在linux系统上安装,执行以下的安装命令。其他的操作系统,比如windows、mac等在官网上(https://prometheus.io/download/)下载并安装。
wget https://github.com/prometheus/prometheus/releases/download/v2.19.2/prometheus-2.19.2.darwin-amd64.tar.gz
tar xvfz prometheus-*.tar.gz
cd prometheus-*
修改Prometheus的配置文件prometheus.yml,代码如下:
global:
scrape_interval: 15s # By default, scrape targets every 15 seconds.
# Attach these labels to any time series or alerts when communicating with
# external systems (federation, remote storage, Alertmanager).
external_labels:
monitor: ‘codelab-monitor’
# A scrape configuration containing exactly one endpoint to scrape:
# Here it’s Prometheus itself.
scrape_configs:
# The job name is added as a label `job=` to any timeseries scraped from this config.
– job_name: ‘prometheus’
# Override the global default and scrape targets from this job every 5 seconds.
scrape_interval: 5s
static_configs:
– targets: [‘localhost:9090’]
– job_name: ‘springboot_prometheus’
scrape_interval: 5s
metrics_path: ‘/actuator/prometheus’
static_configs:
– targets: [‘127.0.0.1:8081’]
config.job_name,配置job的名称
config.scrape_interval,配置多久抓一次监控信息
config.metrics_path,获取监控信息的接口
config.static_configs.targets配置获取监控信息的地址。
使用以下的命令启动prometheus,并通过–config.file指定配置文件
./prometheus –config.file=prometheus.yml
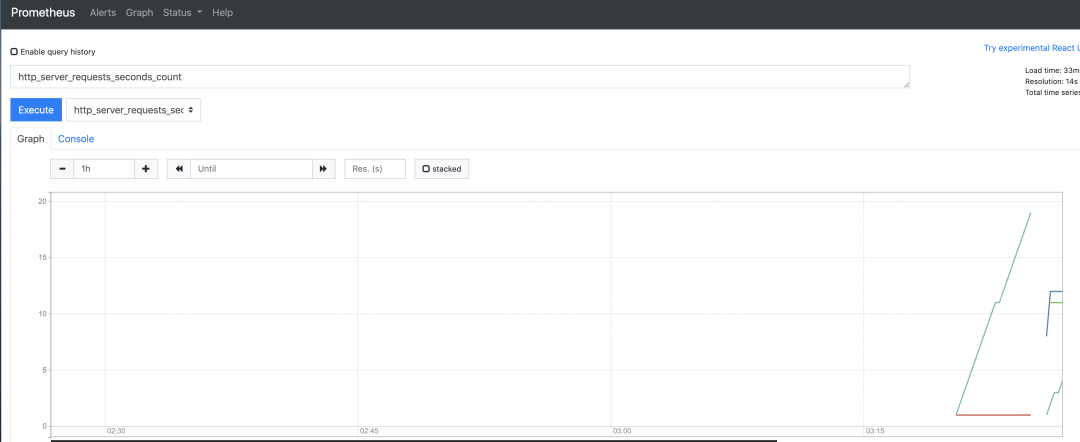
多次请求springboot项目的接口http://localhost:8081/test , 并访问prometheus的控制台http://localhost:9090/,展示的界面如下:
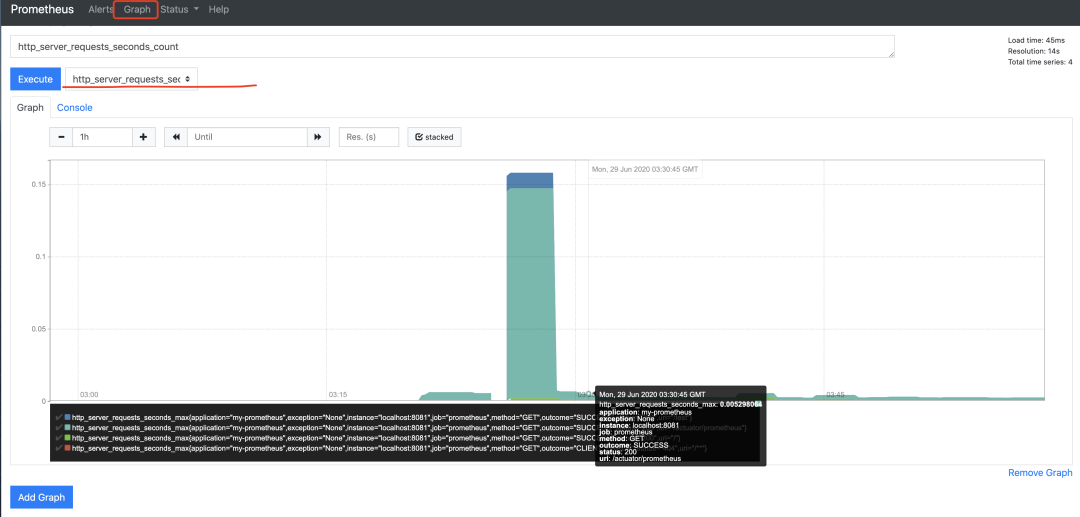
prometheus提供了一些可视化图,比如使用柱状图来展示每秒请求数:
安装grafana
grafana 是一款采用 go 语言编写的开源应用,主要用于大规模指标数据的可视化展现,是网络架构和应用分析中最流行的时序数据展示工具,目前已经支持绝大部分常用的时序数据库。使用grafana去展示prometheus上的数据。先安装,安装命令如下:
wget https://dl.grafana.com/oss/release/grafana-7.0.4.darwin-amd64.tar.gz
tar -zxvf grafana-7.0.4.darwin-amd64.tar.gz
./grafana-server
访问http://localhost:3000/,初始密码:admin/admin。
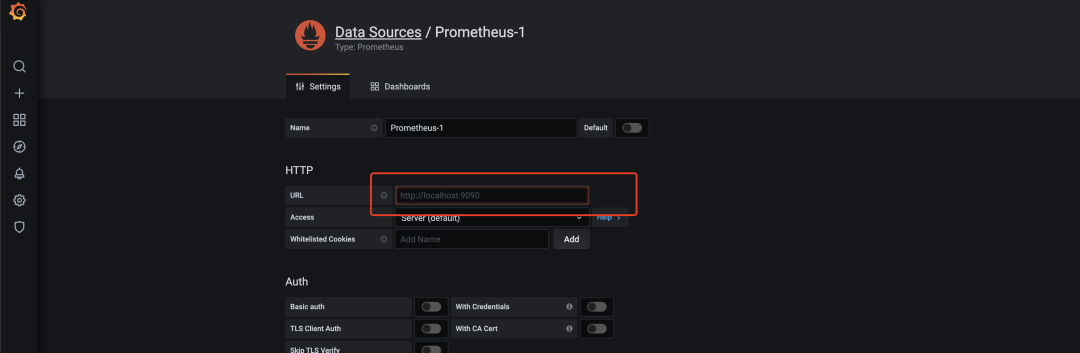
配置数据源,如图:
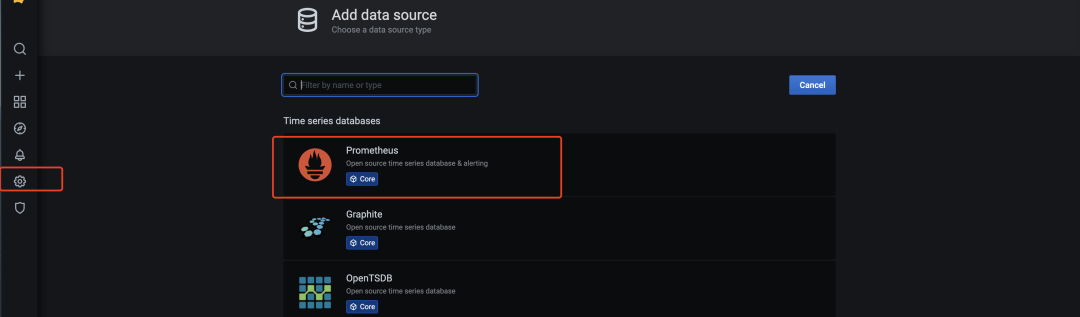
配置prometheus的地址:http://localhost:9090 ,如图所示:
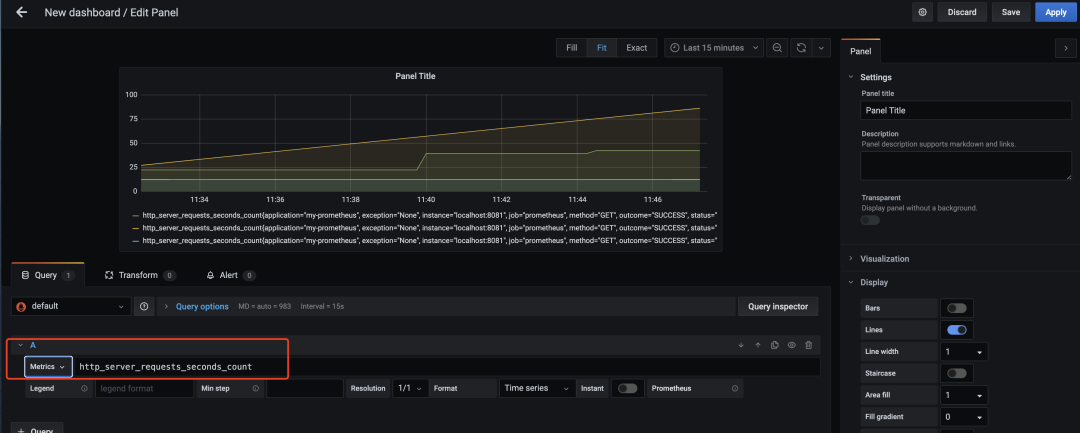
在dashboard界面新建panel,展示的metrics为http_server_request_seconds_count,即展示了以时间为横轴,请求数为纵轴的请求曲线,如图所示:
参考资料
[Prometheus 入门与实践]
发布者:全栈程序员-站长,转载请注明出处:https://javaforall.net/161775.html原文链接:https://javaforall.net


