
大家好,又见面了,我是你们的朋友全栈君。
由于项目中需要使用Visifire所以自己就写了一些demo,大家一起共享!
基础Visifire图表的展示
1.Visifire的创建需要引用的DLL包【WPFToolkit.dll;WPFVisifire.Charts;WPFVisifire.Gauges(这个以后会用到)】
2.我们开始创建简单的Visifire图表
第一步:前台代码
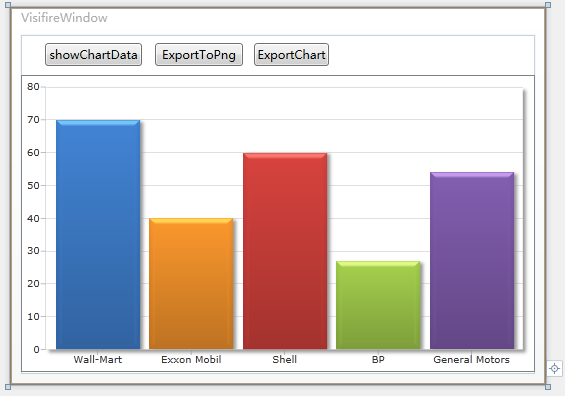
<Window x:Class="Wpf_Tray.VisifireWindow" xmlns="http://schemas.microsoft.com/winfx/2006/xaml/presentation" xmlns:x="http://schemas.microsoft.com/winfx/2006/xaml" xmlns:vc="clr-namespace:Visifire.Charts;assembly=WPFVisifire.Charts" Title="VisifireWindow" Height="378" Width="536" WindowStartupLocation="CenterScreen"> <Grid Name="LayoutRoot"> <vc:Chart Name="chart" DockPanel.Dock="Left" Margin="0,40,0,2" /> <Button Content="showChartData" Height="23" HorizontalAlignment="Left" Margin="24,8,0,0" Name="btn_showChartData" VerticalAlignment="Top" Width="97" Click="btn_showChartData_Click" /> <Button Content="ExportToPng" Height="23" HorizontalAlignment="Left" Margin="134,8,0,0" Name="btn_ExportToPng" VerticalAlignment="Top" Width="88" Click="btn_ExportToPng_Click" /> <Button Content="ExportChart" Height="23" HorizontalAlignment="Left" Margin="233,8,0,0" Name="btn_ExportChart" Click="btn_ExportChart_Click" VerticalAlignment="Top" Width="75" /> </Grid></Window>写完后的一个显示效果,如图;

第二步:
实现后台绑定数据,上代码:
/// <summary> /// 绑定数据 /// </summary> private void BindData() { DataSet ds = DBSQLHelper.Search("select * from hospitalorg",null, CommandType.Text); BindChart(ds.Tables[0]); }
#region 绑定界面上的Chart
        /// <summary>
        /// 绑定界面上的Chart
        /// </summary>
        /// <param name="dt">Chart数据源</param>
        public void BindChart(DataTable dtChart)
        {
            //绑定Chart
            this.chart.Series.Clear();
            this.chart.Titles.Clear();

            this.chart.AnimationEnabled = true;
            this.chart.ThemeEnabled = true;
            this.chart.Width = 500;
            this.chart.Height = 300;

            //使Chart显示三维
            this.chart.View3D = true;

            DataSeries dataSeries = new DataSeries();
            //Chart的实例这是以饼图显示       Bubble

            DataPoint datapoint = null;

            for (int i = 0; i < dtChart.Rows.Count; i++)
            {
                datapoint = new DataPoint();
                datapoint.AxisXLabel = dtChart.Rows[i]["hospitalName"].ToString();
                datapoint.YValue = Convert.ToDouble(dtChart.Rows[i]["hospitalId"].ToString());
                datapoint.Tag = dtChart.Rows[i]["hospitalId"].ToString();
                //DataPoint被点击执行事件
                datapoint.MouseLeftButtonDown += new MouseButtonEventHandler(datapoint_MouseLeftButtonDown);
                dataSeries.DataPoints.Add(datapoint);
            }
            //绑定当鼠标放上去显示的信息
            dataSeries.LabelAngle = -30;
            this.chart.Series.Add(dataSeries);

            Title title = new Title();
            title.Text = "某某医院...";
            this.chart.Titles.Add(title);

            this.chart.ShadowEnabled = true;
        }

        #endregion
public VisifireWindow() { InitializeComponent(); BindData(); }
绑定后的效果,如图:
这是绑定一列的!
第三步:
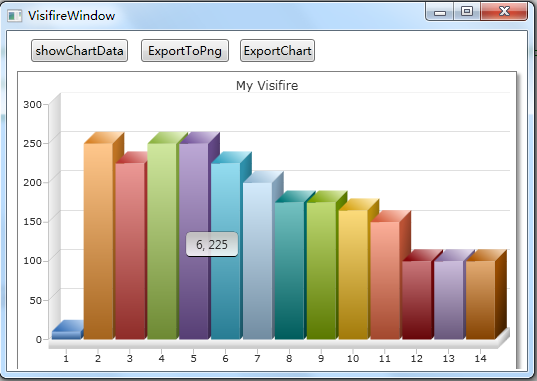
如图,有三个按钮,‘showChartData’,‘ExportToPng’
1.showChartData,主要是多列数据绑定,实现效果如图:

上代码:
#region 可以显示多列,绑定界面Chart private void BindMoreColumnChart(DataTable dtChart) { this.chart.Series.Clear(); this.chart.AnimationEnabled = true; this.chart.View3D = true; DataSeries dataSeries = new DataSeries(); dataSeries.RenderAs = RenderAs.Bar; dataSeries.LabelEnabled = true; dataSeries.LegendText = "最小值";//图例显示的信息 dataSeries.LabelText = "#AxisXLabel, #YValue"; DataPoint datapoint; for (int i = 0; i < dtChart.Rows.Count; i++) { datapoint = new DataPoint(); datapoint.AxisXLabel = dtChart.Rows[i]["job_id"].ToString(); datapoint.YValue = Convert.ToDouble(dtChart.Rows[i]["min_lvl"].ToString()); dataSeries.DataPoints.Add(datapoint); } this.chart.Series.Add(dataSeries); DataSeries dataSeries1 = new DataSeries(); dataSeries1.RenderAs = RenderAs.Bar; dataSeries1.LabelEnabled = true; DataPoint datapoint1; for (int i = 0; i < dtChart.Rows.Count; i++) { datapoint1 = new DataPoint(); datapoint1.AxisXLabel = dtChart.Rows[i]["job_id"].ToString(); datapoint1.YValue = Convert.ToDouble(dtChart.Rows[i]["max_lvl"].ToString()); dataSeries1.DataPoints.Add(datapoint1); } dataSeries1.LegendText = "最大值"; dataSeries1.LabelText = "#AxisXLabel, #YValue"; this.chart.Series.Add(dataSeries1); this.chart.ShadowEnabled = true; } #endregion2.ExportTopng,是将visifire当前实现的图表导成png,上代码:
#region ExportToPng /// <summary> /// ExportToPng /// </summary> /// <param name="path"></param> /// <param name="surface"></param> public void ExportToPng(Uri path,Visifire.Charts.Chart surface) { if (path == null) return; //Save current canvas transform 保存当前画布变换 Transform transform = surface.LayoutTransform; //reset current transform (in case it is scaled or rotated) 重设当前画布(如果缩放或旋转) surface.LayoutTransform = null; //Create a render bitmap and push the surface to it 创建一个渲染位图和表面 RenderTargetBitmap renderBitmap = new RenderTargetBitmap( (int)surface.Width, (int)surface.Height, 96d, 96d, PixelFormats.Pbgra32); renderBitmap.Render(surface); // Create a file stream for saving image using (FileStream outStream = new FileStream(path.LocalPath,FileMode.Create)) { //Use png encoder for our data PngBitmapEncoder encoder = new PngBitmapEncoder(); // push the rendered bitmap to it encoder.Frames.Add(BitmapFrame.Create(renderBitmap)); // save the data to the stream encoder.Save(outStream); } // Restore previously saved layout 恢复以前保存布局 surface.LayoutTransform = transform; } #endregion#region 将Visifire图表保存为图片 http://www.visifire.com/blog/page/15/ private void btn_ExportToPng_Click(object sender, RoutedEventArgs e) { ExportToPng(new Uri("D:/Visifire.png"), this.chart); }#endregion
【这只是基础,大家可以了解下,想起昨天看大本营了,快乐未完待续,我想说,学习未完待续!大家可以看看visifire官方网站的文档进行学习,http//www.visifire.com/】
版权声明:本文内容由互联网用户自发贡献,该文观点仅代表作者本人。本站仅提供信息存储空间服务,不拥有所有权,不承担相关法律责任。如发现本站有涉嫌侵权/违法违规的内容, 请联系我们举报,一经查实,本站将立刻删除。
发布者:全栈程序员-站长,转载请注明出处:https://javaforall.net/162778.html原文链接:https://javaforall.net


