
大家好,又见面了,我是你们的朋友全栈君。
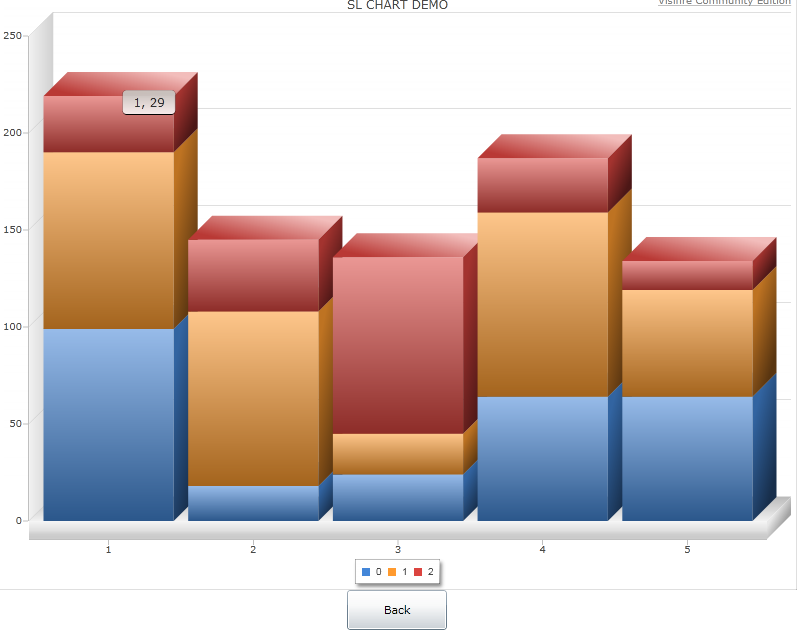
初始化生成一个堆叠柱状图,点击不同的堆叠部分显示该部分的详情,用柱状图。点击柱状图继续显示详情,用饼图。透明度从0到1的切换效果。BACK按钮,返回上一张Chart。
XAML:
<UserControl x:Class=”Simple.Page”
xmlns=”http://schemas.microsoft.com/winfx/2006/xaml/presentation”
xmlns:x=”http://schemas.microsoft.com/winfx/2006/xaml”
Width=”800″ Height=”640″>
<Grid x:Name=”LayoutRoot” Background=”White”>
<Grid.Resources>
<Storyboard x:Name=”storyboard”>
<DoubleAnimation x:Name=”storyboardDA” From=”1″ To=”0″
Storyboard.TargetName=”ChartPanel” Storyboard.TargetProperty=”UIElement. Opacity”
AutoReverse=”False” Duration=”0:0:1″ >
</DoubleAnimation>
</Storyboard>
</Grid.Resources>
<StackPanel>
<Grid x:Name=”ChartPanel” Height=”600″ Width=”800″>
</Grid>
<Button x:Name=”Btn_Back” Width=”100″ Height=”40″ Content=”Back” Click=”Btn_Back_Click” ></Button>
</StackPanel>
</Grid>
</UserControl>
CS:
using System;
using System.Collections.Generic;
using System.Linq;
using System.Net;
using System.Windows;
using System.Windows.Controls;
using System.Windows.Documents;
using System.Windows.Input;
using System.Windows.Media;
using System.Windows.Media.Animation;
using System.Windows.Shapes;
using Visifire.Charts;
using Visifire.Commons;
namespace Simple
{
public partial class Page : UserControl
{
public Page()
{
InitializeComponent();
// Create a new Visifire Chart
CreateChart();
}
/// <summary>
/// Function to create a chart
/// </summary>
public void CreateChart()
{
Chart chart = new Chart();
chart.View3D = true;
chart.Width = 800;
chart.Height = 600;
Title title = new Title();
title.Text = “SL CHART DEMO”;
chart.Titles.Add(title);
for (int c = 0; c < 3;c++ )
{
DataSeries dataSeries = new DataSeries();
dataSeries.RenderAs = RenderAs.StackedColumn;
dataSeries.LegendText = c.ToString();
DataPoint dataPoint;
for (int i = 0; i < 5; i++)
{
dataPoint = new DataPoint();
dataPoint.YValue = rand.Next(10, 100);
dataPoint.MouseLeftButtonDown += new MouseButtonEventHandler(dataPoint_MouseLeftButtonDown);
dataSeries.DataPoints.Add(dataPoint);
}
chart.Series.Add(dataSeries);
}
this.ChartPanel.Children.Add(chart);
this.currentSetp = 1;
}
void dataPoint_MouseLeftButtonDown(object sender, MouseButtonEventArgs e)
{
this.HideDispaly();
this.ChartPanel.Children.Clear();
this.CreateCreateColumnChart();
}
void dataPoint_MouseLeftButtonDownColumnChart(object sender, MouseButtonEventArgs e)
{
this.HideDispaly();
this.ChartPanel.Children.Clear();
this.CreateCreatePieChart();
}
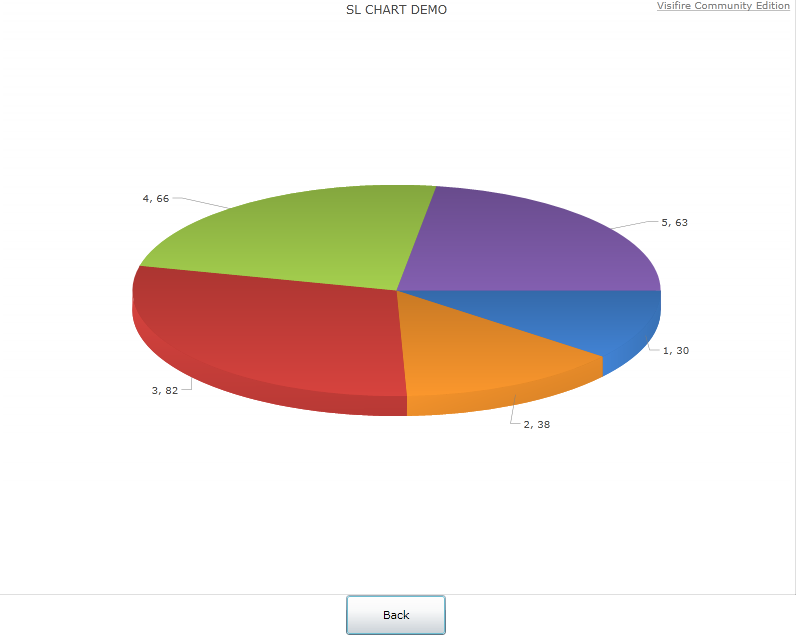
private void CreateCreatePieChart()
{
Chart chart = new Chart();
chart.View3D = true;
chart.Width = 800;
chart.Height = 600;
Title title = new Title();
title.Text = “SL CHART DEMO”;
chart.Titles.Add(title);
DataSeries dataSeries = new DataSeries();
dataSeries.RenderAs = RenderAs.Pie;
dataSeries.LegendText = “”;
DataPoint dataPoint;
for (int i = 0; i < 5; i++)
{
dataPoint = new DataPoint();
dataPoint.YValue = rand.Next(10, 100);
dataSeries.DataPoints.Add(dataPoint);
}
chart.Series.Add(dataSeries);
this.ChartPanel.Children.Add(chart);
this.currentSetp = 3;
}
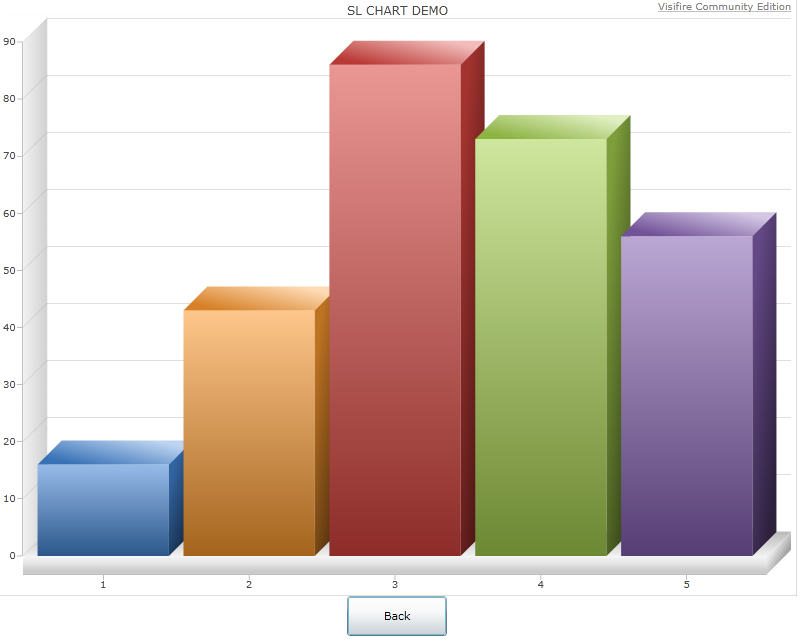
private void CreateCreateColumnChart()
{
Chart chart = new Chart();
chart.View3D = true;
chart.Width = 800;
chart.Height = 600;
Title title = new Title();
title.Text = “SL CHART DEMO”;
chart.Titles.Add(title);
DataSeries dataSeries = new DataSeries();
dataSeries.RenderAs = RenderAs.Column;
dataSeries.LegendText = “”;
DataPoint dataPoint;
for (int i = 0; i < 5; i++)
{
dataPoint = new DataPoint();
dataPoint.YValue = rand.Next(10, 100);
dataPoint.MouseLeftButtonDown += new MouseButtonEventHandler(dataPoint_MouseLeftButtonDownColumnChart);
dataSeries.DataPoints.Add(dataPoint);
}
chart.Series.Add(dataSeries);
this.ChartPanel.Children.Add(chart);
this.currentSetp = 2;
}
/// <summary>
/// Create a random class variable
/// </summary>
Random rand = new Random(DateTime.Now.Millisecond);
private int currentSetp = 0;
private void GoStep(int currentStep)
{
if (currentStep == 1)
{
return;
}
if (currentStep == 2)
{
this.ChartPanel.Children.Clear();
this.CreateChart();
}
if (currentStep == 3)
{
this.ChartPanel.Children.Clear();
this.CreateCreateColumnChart();
}
}
private void Btn_Back_Click(object sender, RoutedEventArgs e)
{
this.GoStep(currentSetp);
this.HideDispaly();
}
private void HideDispaly()
{
this.storyboardDA.From = 0;
this.storyboardDA.To = 1;
this.storyboard.Begin();
}
}
}

转载于:https://www.cnblogs.com/kklldog/archive/2010/07/02/1769886.html
发布者:全栈程序员-站长,转载请注明出处:https://javaforall.net/162812.html原文链接:https://javaforall.net

![[转载] 七龙珠第一部——第104话 悟空复活吧](https://javaforall.net/wp-content/uploads/2020/11/2020110817443450-480x300.jpg)
