
matlab中wavedec2,2-D wavelet decomposition

matlab中wavedec2,2-D wavelet decompositionThisexampleshowsthestructureofwavedec2outputmatrices.Loadanddisplayanimage.loadwomanimagesc(X)colormap(map)Savethecurrentdiscretewavelettransformextensionmode.origMode=dwtmode(‘s…

大家好,又见面了,我是你们的朋友全栈君。

This example shows the structure of wavedec2 output matrices.

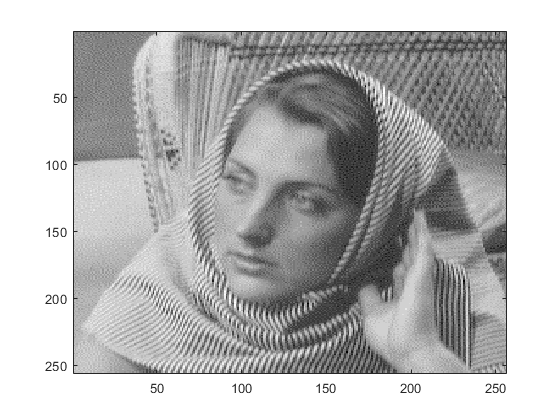
Load and display an image.

load woman

imagesc(X)

colormap(map)
c109d7b0bb6dd927a2834578d9e62792.png

Save the current discrete wavelet transform extension mode.

origMode = dwtmode(‘status’,’nodisplay’);

Change to periodic boundary handling. The dwtmode function displays a message indicating that the DWT extension mode is changing.

dwtmode(‘per’)

!!!!!!!!!!!!!!!!!!!!!!!!!!!!!!!!!!!!!!!!

! WARNING: Change DWT Extension Mode !

!!!!!!!!!!!!!!!!!!!!!!!!!!!!!!!!!!!!!!!!

*****************************************

** DWT Extension Mode: Periodization **

*****************************************

Perform a level 3 decomposition of the image using the db1 (Haar) wavelet.

[c,s] = wavedec2(X,3,’db1′);

Return the number of elements in the image X and coefficient vector c. Confirm the number of elements in each are equal.

numel(X)

ans = 65536

numel(c)

ans = 65536

Display the bookkeeping matrix s. The first row displays the dimensions of the coarse scale approximation of the image. The last row displays the dimensions of the original image. The intermediate rows display the dimensions of the detail coefficients at the three levels of the decomposition, proceeding from coarse to fine scale.

s

s = 5×2

32 32

32 32

64 64

128 128

256 256

Reset discrete wavelet transform extension mode to its original mode.

dwtmode(origMode,’nodisplay’)

版权声明:本文内容由互联网用户自发贡献,该文观点仅代表作者本人。本站仅提供信息存储空间服务,不拥有所有权,不承担相关法律责任。如发现本站有涉嫌侵权/违法违规的内容, 请发送邮件至 举报,一经查实,本站将立刻删除。

发布者:全栈程序员-站长,转载请注明出处:https://javaforall.net/163770.html原文链接:https://javaforall.net

赞 (0)
全栈程序员-站长的头像全栈程序员-站长


相关推荐

  • Drupal Views教程[通俗易懂]

    Drupal Views教程[通俗易懂](一):简介打个比方来说明一下Views的作用:Drupal的核心就像一个毛坯房,墙窗户门都有了,也简单的粉刷过了,搬进来也能住;外观主题(Theme)就像室内装修,可以按照自己的喜好来铺地板或是地毯,选择各种各样喜欢的墙纸等等;模块呢,就好比家具,电器之类的,有了模块可以方便实现各种方便的功能,大部分模块都像冰箱电视一样,启动,摆在那里就行了,但是有些模块可以说是大工程,譬如C

    2022年5月4日
  • r语言求平均值_r语言计算中位数

    r语言求平均值_r语言计算中位数R中的统计分析通过使用许多内置函数来执行的,这些函数大部分是R基础包的一部分,并且它们将R向量与参数一起作为输入,并在执行计算后给出结果。先来看如何求平均值。平均值是通过取数值的总和并除以数据序列中的值的数量来计算,函数mean()用于在R中计算平均值,语法如下:mean(x,trim=0,na.rm=FALSE,…)参数描述如下:x-是输入向量。 t…

    2022年9月15日
  • MATLAB plotyy总结「建议收藏」

    MATLAB plotyy总结「建议收藏」当需要画出2个两个不同纵坐标的图时,此时的横坐标的图是相同的,在MATLAB中这个函数叫plotyy下面列举的是一个简单的画plotyy的应用几种不同的调用格式1、plotyy(X1,Y1,X2,Y2)2、plotyy(X1,Y1,X2,Y2,function)3、plotyy(X1,Y1,X2,Y2,’function1′,’function2′)4、[AX,H1,H2]=plotyy(___)5、plotyy(AX1,___)1、plotyy(X1,Y1,X2,Y2)直接简单地画

    2022年6月16日
  • 如何为pycharm配置解释器_python解释器加入pycharm

    如何为pycharm配置解释器_python解释器加入pycharm我们需要提前下载好python解释器解释器可以在Python解释器官网下载,这里我下载的是3.8.8版本的1、在我们安装好pycharm的时候,并不是直接可以用的,我们还需要配置解释器,不配置解释器的话,就会出现下面这种情况。此时,小伙伴们莫慌,只要我们配置好解释器就可以了。2、首先点击上图中“ConfigurePythonInterpreter”,之后Pycharm就会自动定位到“ProjectInterpreter”这个位置,如下图所示,该界面是Pycharm的设置窗口之一,专门用

    2022年8月26日
  • Bootstrap 流式布局

    Bootstrap 流式布局流式布局同理,将Bootstrap的流式栅格放到class="container-fluid"的流式容器中,即可创建流式布局。流式布局将填满整个视口宽度。如:<divclass="container-fluid"> <divclass="row-fluid">   <divclass="span2">     <!–

    2022年10月24日
  • JAVA Socket详解

    1问题引入1.1网络架构模型网络架构模型主要有OSI参考模型和TCP/IP五层模型1.1.1OSI参考模型OSI(OpenSystemInterconnect),即开放式系统互联。一般都叫OSI参考模型,是ISO(国际标准化组织)组织在1985年研究的网络互连模型。ISO为了更好的使网络应用更为普及,推出了O…

    2022年4月4日

发表回复

您的邮箱地址不会被公开。 必填项已用 * 标注

关注全栈程序员社区公众号