
大家好,又见面了,我是你们的朋友全栈君。如果您正在找激活码,请点击查看最新教程,关注关注公众号 “全栈程序员社区” 获取激活教程,可能之前旧版本教程已经失效.最新Idea2022.1教程亲测有效,一键激活。
Jetbrains全系列IDE稳定放心使用
导读:记录一下如何使用matlab画柱状图,并进行填充。
版本:
    matlab 2017b.
注意:使用matlab2016版本似乎会有bug。
1.辅助函数makehatch.m
function A = makehatch(hatch)
%MAKEHATCH Predefined hatch patterns
%  MAKEHATCH(HATCH) returns a matrix with the hatch pattern for HATCH
%   according to the following table:
%      HATCH        pattern
%     -------      ---------
%        /          right-slanted lines
%        \          left-slanted lines
%        |          vertical lines
%        -          horizontal lines
%        +          crossing vertical and horizontal lines
%        x          criss-crossing lines
%        .          single dots
%
%  See also: APPLYHATCH

%  Copyright 2002-2009 The MathWorks, Inc.

n = 6;
A=zeros(n);
switch (hatch)
 case '/'
  A = fliplr(eye(n));
 case '\'
  A = eye(n);
 case '|'
  A(:,1) = 1;
 case '-'
  A(1,:) = 1;
 case '+'
  A(:,1) = 1;
  A(1,:) = 1;
 case 'x'
  A = eye(n) | fliplr(diag(ones(n-1,1),-1));
 case '.'
  A(1:2,1:2)=1;
 otherwise
  error(['Undefined hatch pattern "' hatch '".']);
end
2.辅助函数applyhatch.m
function applyhatch(h,patterns,colorlist)
%APPLYHATCH Apply hatched patterns to a figure
%  APPLYHATCH(H,PATTERNS) creates a new figure from the figure H by
%  replacing distinct colors in H with the black and white
%  patterns in PATTERNS. The format for PATTERNS can be
%    a string of the characters '/', '\', '|', '-', '+', 'x', '.'
%    a cell array of matrices of zeros (white) and ones (black)
%
%  APPLYHATCH(H,PATTERNS,COLORS) maps the colors in the n by 3
%  matrix COLORS to PATTERNS. Each row of COLORS specifies an RGB
%  color value.
%
%  Note this function makes a bitmap image of H and so is limited
%  to low-resolution, bitmap output.
%
%  Example 1:
%    bar(rand(3,4));
%    applyhatch(gcf,'\-x.');
%
%  Example 2:
%    colormap(cool(6));
%    pie(rand(6,1));
%    legend('Jan','Feb','Mar','Apr','May','Jun');
%    applyhatch(gcf,'|-+.\/',cool(6));
%
%  See also: MAKEHATCH

%  Copyright 2002-2009 The MathWorks, Inc.

oldppmode = get(h,'paperpositionmode');
oldunits = get(h,'units');
set(h,'paperpositionmode','auto');
set(h,'units','pixels');
figsize = get(h,'position');
if nargin == 2
  colorlist = [];
end
if verLessThan('matlab','8.4.0')
  bits = hardcopy(h,'-dzbuffer','-r0');
else
  bits = print(h,'-RGBImage','-r0');
end
set(h,'paperpositionmode',oldppmode);

bwidth = size(bits,2);
bheight = size(bits,1);
bsize = bwidth * bheight;
if ~isempty(colorlist)
  colorlist = uint8(255*colorlist);
  [colors,colori] = nextnonbw(0,colorlist,bits);
else
  colors = (bits(:,:,1) ~= bits(:,:,2)) | ...
	   (bits(:,:,1) ~= bits(:,:,3));
end
pati = 1;
colorind = find(colors);
while ~isempty(colorind)
  colorval(1) = bits(colorind(1));
  colorval(2) = bits(colorind(1)+bsize);
  colorval(3) = bits(colorind(1)+2*bsize);
  if iscell(patterns)
    pattern = patterns{
   pati};
  elseif isa(patterns,'char')
    pattern = makehatch(patterns(pati));
  else
    pattern = patterns;
  end
  pattern = uint8(255*(1-pattern));
  pheight = size(pattern,2);
  pwidth = size(pattern,1);
  ratioh = ceil(bheight/pheight);
  ratiow = ceil(bwidth/pwidth);
  bigpattern = repmat(pattern,[ratioh ratiow]);
  if ratioh*pheight > bheight
    bigpattern(bheight+1:end,:) = [];
  end
  if ratiow*pwidth > bwidth
    bigpattern(:,bwidth+1:end) = [];
  end
  bigpattern = repmat(bigpattern,[1 1 3]);
  color = (bits(:,:,1) == colorval(1)) & ...
	  (bits(:,:,2) == colorval(2)) & ...
	  (bits(:,:,3) == colorval(3));
  color = repmat(color,[1 1 3]);
  bits(color) = bigpattern(color);
  if ~isempty(colorlist)
    [colors,colori] = nextnonbw(colori,colorlist,bits);
  else
    colors = (bits(:,:,1) ~= bits(:,:,2)) | ...
	     (bits(:,:,1) ~= bits(:,:,3));
  end
  colorind = find(colors);
  pati = (pati + 1);
  if pati > length(patterns)
    pati = 1;
  end
end

newfig = figure('units','pixels','visible','off');
imaxes = axes('parent',newfig,'units','pixels');
im = image(bits,'parent',imaxes);
fpos = get(newfig,'position');
set(newfig,'position',[fpos(1:2) figsize(3) figsize(4)+1]);
set(imaxes,'position',[0 0 figsize(3) figsize(4)+1],'visible','off');
set(newfig,'visible','on');

function [colors,out] = nextnonbw(ind,colorlist,bits)
out = ind+1;
colors = [];
while out <= size(colorlist,1)
  if isequal(colorlist(out,:),[255 255 255]) | ...
	isequal(colorlist(out,:),[0 0 0])
    out = out+1;
  else
    colors = (colorlist(out,1) == bits(:,:,1)) & ...
	     (colorlist(out,2) == bits(:,:,2)) & ...
	     (colorlist(out,3) == bits(:,:,3));
    return
  end
end
3.画柱状图的.m文件,其中调用了applyhatch()函数
%If you want to adjust the pattern to 6 bar such as " applyhatch(gcf,'.-+/|x');",
%try to type this "applyhatch(gcf,'.-++/||xx');" instedly.
%So you can avoid the duplicated pattern at least, even order problem is still not solved.
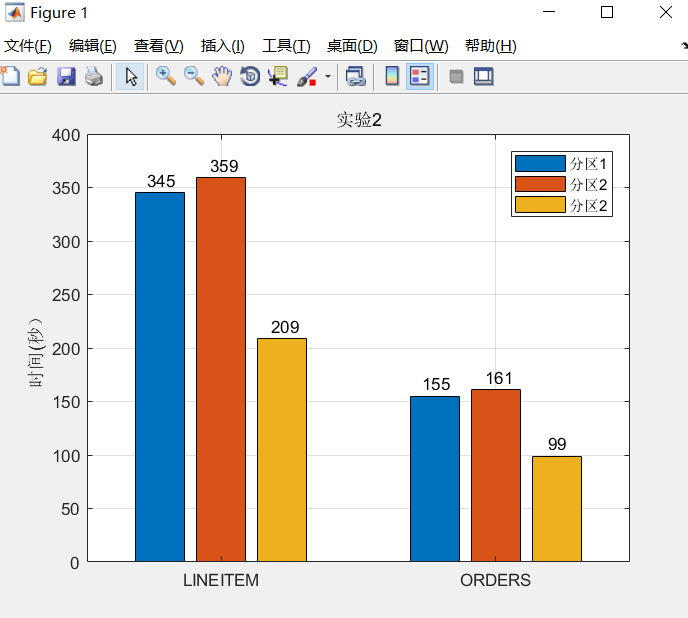
data=[345,359,209;155,161,99];%三列的柱状图,分为了两种,具体见图
b=bar(data);%画柱状图
text(0.73,345+12,'345');%设置柱状图上的数值大小
text(0.73+0.23,359+12,'359');
text(0.73+0.45,209+12,'209');
text(0.73+1,155+12,'155');
text(0.73+1+0.23,161+12,'161');
text(0.73+1+0.46,99+12,'99');
grid on;%添加网格线
%ch = get(b,'children');
title('实验2')
set(gca,'XTickLabel',{
'LINEITEM','ORDERS'})%设置X轴显示
%set(ch,'FaceVertexCData',[0 0 1;1 0 0;0 1 0])
legend('分区1','分区2','分区2');%设置
ylabel('时间(秒)');%设置y轴名字
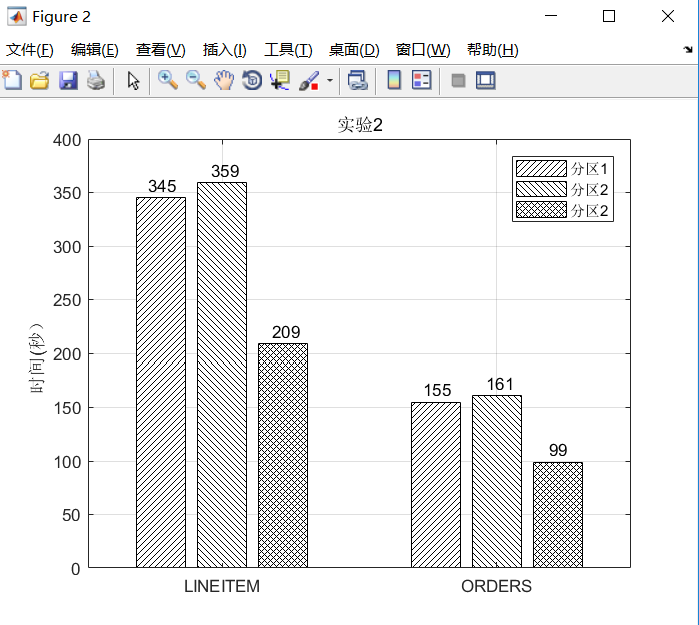
applyhatch(gcf,'/\xx');%对原图添加填充,这里有个bug就是xx需要输入两次
显示结果:

填充后效果:
版权声明:本文内容由互联网用户自发贡献,该文观点仅代表作者本人。本站仅提供信息存储空间服务,不拥有所有权,不承担相关法律责任。如发现本站有涉嫌侵权/违法违规的内容, 请联系我们举报,一经查实,本站将立刻删除。
发布者:全栈程序员-站长,转载请注明出处:https://javaforall.net/180434.html原文链接:https://javaforall.net


