
大家好,又见面了,我是你们的朋友全栈君。如果您正在找激活码,请点击查看最新教程,关注关注公众号 “全栈程序员社区” 获取激活教程,可能之前旧版本教程已经失效.最新Idea2022.1教程亲测有效,一键激活。
Jetbrains全系列IDE稳定放心使用
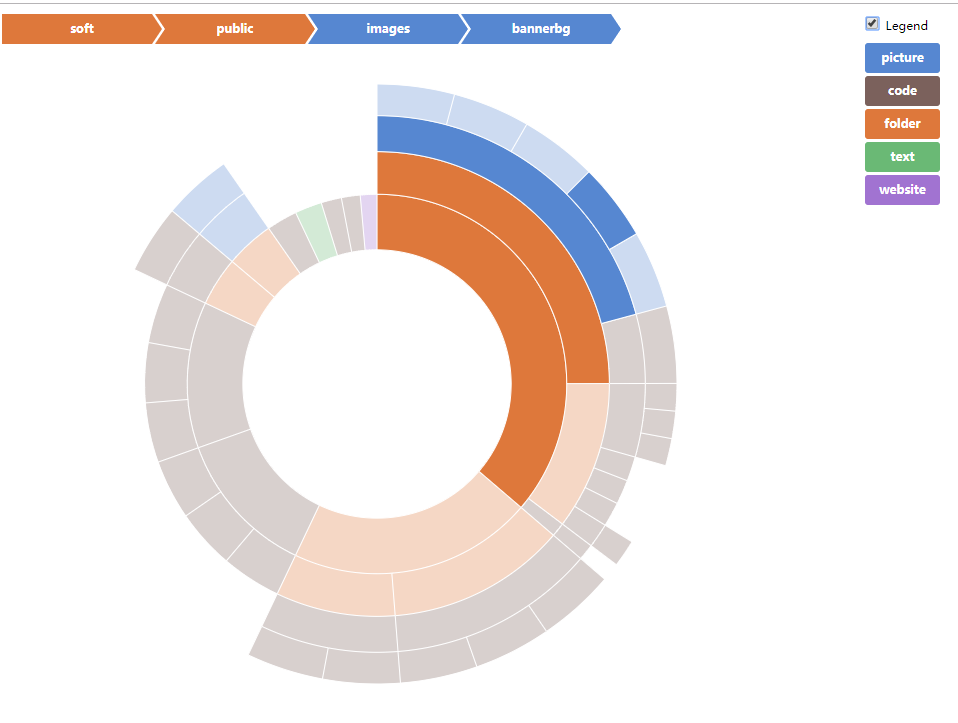
本文将介绍D3旭日图的画法
下面我们先来看看结果展示

html代码
<!DOCTYPE html>
<html>
  <head>
    <meta charset="utf-8">
    <title>Sequences sunburst</title>
    <script src="js/d3.min.js"></script>
    <!-- 此处需要引入d3.js的文件 -->
    <link rel="stylesheet" type="text/css" href="css/sequences.css"/>
  </head>
  <body>
    <div id="main">
      <div id="sequence"></div>
      <div id="chart">
      </div>
    </div>
    <div id="sidebar">
      <input type="checkbox" id="togglelegend"> Legend<br/>
      <div id="legend" style="visibility: hidden;"></div>
    </div>
    <script type="text/javascript" src="js/sequences.js"></script>
  </body>
</html>
css代码(文件名sequences.css)
body {
  font-family: 'Open Sans', sans-serif;
  font-size: 12px;
  font-weight: 400;
  background-color: #fff;
  width: 960px;
  height: 700px;
  margin-top: 10px;
}

#main {
  float: left;
  width: 750px;
}

#sidebar {
  float: right;
  width: 100px;
}

#sequence {
  width: 600px;
  height: 70px;
}

#legend {
  padding: 10px 0 0 3px;
}

#sequence text, #legend text {
  font-weight: 600;
  fill: #fff;
}

#chart {
  position: relative;
}

#chart path {
  stroke: #fff;
}

#explanation {
  position: absolute;
  top: 260px;
  left: 305px;
  width: 140px;
  text-align: center;
  color: #666;
  z-index: -1;
}

#percentage {
  font-size: 2.5em;
}
js代码(文件名sequences.js)
// Dimensions of sunburst.
var width = 750;
var height = 600;
var radius = Math.min(width, height) / 2;

// Breadcrumb dimensions: width, height, spacing, width of tip/tail.
var b = {
  w: 150, h: 30, s: 3, t: 10
};

// Mapping of step names to colors.
var colors = {
  "picture": "#5687d1",
  "code": "#7b615c",
  "folder": "#de783b",
  "text": "#6ab975",
  "website": "#a173d1"
};

// Total size of all segments; we set this later, after loading the data.
var totalSize = 0;

var vis = d3.select("#chart").append("svg:svg")
    .attr("width", width)
    .attr("height", height)
    .append("svg:g")
    .attr("id", "container")
    .attr("transform", "translate(" + width / 2 + "," + height / 2 + ")");

var partition = d3.layout.partition()
    .size([2 * Math.PI, radius * radius])
    .value(function(d) { return d.size; });

var arc = d3.svg.arc()
    .startAngle(function(d) { return d.x; })
    .endAngle(function(d) { return d.x + d.dx; })
    .innerRadius(function(d) { return Math.sqrt(d.y); })
    .outerRadius(function(d) { return Math.sqrt(d.y + d.dy); });

// Use d3.text and d3.csv.parseRows so that we do not need to have a header
// row, and can receive the csv as an array of arrays.
d3.text("data.csv", function(text) {
  var csv = d3.csv.parseRows(text);
  var json = buildHierarchy(csv);
	console.log(json);
  createVisualization(json);
});
function getCaption(obj){
    var index=obj.lastIndexOf("\.");
    obj=obj.substring(index+1,obj.length);
//  console.log(obj);
    return obj;
}
function getStr(obj){
    var str=obj.split('.')[0]
    return str;
}

// Main function to draw and set up the visualization, once we have the data.
function createVisualization(json) {

  // Basic setup of page elements.
  initializeBreadcrumbTrail();
  drawLegend();
  d3.select("#togglelegend").on("click", toggleLegend);

  // Bounding circle underneath the sunburst, to make it easier to detect
  // when the mouse leaves the parent g.
  vis.append("svg:circle")
      .attr("r", radius)
      .style("opacity", 0);

  // For efficiency, filter nodes to keep only those large enough to see.
  var nodes = partition.nodes(json)
      .filter(function(d) {
      return (d.dx > 0.005); // 0.005 radians = 0.29 degrees
      });

  var path = vis.data([json]).selectAll("path")
      .data(nodes)
      .enter().append("svg:path")
      .attr("display", function(d) { return d.depth ? null : "none"; })
      .attr("d", arc)
      .attr("fill-rule", "evenodd")
      .style("fill", function(d) { return colors[getCaption(d.name)]; })
      .style("opacity", 1)
      .on("mouseover", mouseover);

  // Add the mouseleave handler to the bounding circle.
  d3.select("#container").on("mouseleave", mouseleave);

  // Get total size of the tree = value of root node from partition.
  console.log(path.node())
  console.log(json)
  console.log(path.node().__data__);
  totalSize = path.node().__data__.value;
 };

// Fade all but the current sequence, and show it in the breadcrumb trail.
function mouseover(d) {

  var percentage = (100 * d.value / totalSize).toPrecision(3);
  var percentageString = percentage + "%";
  if (percentage < 0.1) {
    percentageString = "< 0.1%";
  }


  var sequenceArray = getAncestors(d);
  updateBreadcrumbs(sequenceArray, percentageString);

  // Fade all the segments.
  d3.selectAll("path")
      .style("opacity", 0.3);

  // Then highlight only those that are an ancestor of the current segment.
  vis.selectAll("path")
      .filter(function(node) {
                return (sequenceArray.indexOf(node) >= 0);
              })
      .style("opacity", 1);
}

// Restore everything to full opacity when moving off the visualization.
function mouseleave(d) {

  // Hide the breadcrumb trail
  d3.select("#trail")
      .style("visibility", "hidden");

  // Deactivate all segments during transition.
  d3.selectAll("path").on("mouseover", null);

  // Transition each segment to full opacity and then reactivate it.
  d3.selectAll("path")
      .transition()
      .duration(1000)
      .style("opacity", 1)
      .each("end", function() {
              d3.select(this).on("mouseover", mouseover);
            });

  d3.select("#explanation")
      .style("visibility", "hidden");
}

// Given a node in a partition layout, return an array of all of its ancestor
// nodes, highest first, but excluding the root.
function getAncestors(node) {
  var path = [];
  var current = node;
  while (current.parent) {
    path.unshift(current);
    current = current.parent;
  }
  return path;
}

function initializeBreadcrumbTrail() {
  // Add the svg area.
  var trail = d3.select("#sequence").append("svg:svg")
      .attr("width", width)
      .attr("height", 50)
      .attr("id", "trail");
  // Add the label at the end, for the percentage.

}

// Generate a string that describes the points of a breadcrumb polygon.
function breadcrumbPoints(d, i) {
  var points = [];
  points.push("0,0");
  points.push(b.w + ",0");
  points.push(b.w + b.t + "," + (b.h / 2));
  points.push(b.w + "," + b.h);
  points.push("0," + b.h);
  if (i > 0) { // Leftmost breadcrumb; don't include 6th vertex.
    points.push(b.t + "," + (b.h / 2));
  }
  return points.join(" ");
}

// Update the breadcrumb trail to show the current sequence and percentage.
function updateBreadcrumbs(nodeArray, percentageString) {

  // Data join; key function combines name and depth (= position in sequence).
  var g = d3.select("#trail")
      .selectAll("g")
      .data(nodeArray, function(d) { return d.name + d.depth; });

  // Add breadcrumb and label for entering nodes.
  var entering = g.enter().append("svg:g");

  entering.append("svg:polygon")
      .attr("points", breadcrumbPoints)
      .style("fill", function(d) { return colors[getCaption(d.name)]; });

  entering.append("svg:text")
      .attr("x", (b.w + b.t) / 2)
      .attr("y", b.h / 2)
      .attr("dy", "0.35em")
      .attr("text-anchor", "middle")
      .text(function(d) { return getStr(d.name); });

  // Set position for entering and updating nodes.
  g.attr("transform", function(d, i) {
    return "translate(" + i * (b.w + b.s) + ", 0)";
  });

  // Remove exiting nodes.
  g.exit().remove();

  // Now move and update the percentage at the end.
  d3.select("#trail").select("#endlabel")
      .attr("x", (nodeArray.length + 0.5) * (b.w + b.s))
      .attr("y", b.h / 2)
      .attr("dy", "0.35em")
      .attr("text-anchor", "middle")
      .text(percentageString);

  // Make the breadcrumb trail visible, if it's hidden.
  d3.select("#trail")
      .style("visibility", "");

}

function drawLegend() {

  // Dimensions of legend item: width, height, spacing, radius of rounded rect.
  var li = {
    w: 75, h: 30, s: 3, r: 3
  };

  var legend = d3.select("#legend").append("svg:svg")
      .attr("width", li.w)
      .attr("height", d3.keys(colors).length * (li.h + li.s));

  var g = legend.selectAll("g")
      .data(d3.entries(colors))
      .enter().append("svg:g")
      .attr("transform", function(d, i) {
              return "translate(0," + i * (li.h + li.s) + ")";
           });

  g.append("svg:rect")
      .attr("rx", li.r)
      .attr("ry", li.r)
      .attr("width", li.w)
      .attr("height", li.h)
      .style("fill", function(d) { return d.value; });

  g.append("svg:text")
      .attr("x", li.w / 2)
      .attr("y", li.h / 2)
      .attr("dy", "0.35em")
      .attr("text-anchor", "middle")
      .text(function(d) { return d.key; });
}

function toggleLegend() {
  var legend = d3.select("#legend");
  if (legend.style("visibility") == "hidden") {
    legend.style("visibility", "");
  } else {
    legend.style("visibility", "hidden");
  }
}

// Take a 2-column CSV and transform it into a hierarchical structure suitable
// for a partition layout. The first column is a sequence of step names, from
// root to leaf, separated by hyphens. The second column is a count of how
// often that sequence occurred.
function buildHierarchy(csv) {
  var root = {"name": "root", "children": []};
  for (var i = 0; i < csv.length; i++) {
    var sequence = csv[i][0];
    var size = +csv[i][1];
    if (isNaN(size)) { // e.g. if this is a header row
      continue;
    }
    var parts = sequence.split(";");
    var currentNode = root;
    for (var j = 0; j < parts.length; j++) {
      var children = currentNode["children"];
      var nodeName = parts[j];
      var childNode;
      if (j + 1 < parts.length) {
   // Not yet at the end of the sequence; move down the tree.
 	var foundChild = false;
 	for (var k = 0; k < children.length; k++) {
 	  if (children[k]["name"] == nodeName) {
 	    childNode = children[k];
 	    foundChild = true;
 	    break;
 	  }
 	}
  // If we don't already have a child node for this branch, create it.
 	if (!foundChild) {
 	  childNode = {"name": nodeName, "children": []};
 	  children.push(childNode);
 	}
 	currentNode = childNode;
      } else {
 	// Reached the end of the sequence; create a leaf node.
 	childNode = {"name": nodeName, "size": size};
 	children.push(childNode);
      }
    }
  }
  return root;
};
所需数据(文件名data.csv)
public.folder;images.picture;pay-jdpay.picture,8888
sql.code;a2.code,8889
sql.code;online-170807.code,8890
sql.code;suggestion.code,8891
soft.folder;public.folder;css.code;main.code,8898
soft.folder;public.folder;images.picture;3_weixin_ltjl.picture,8899
soft.folder;public.folder;images.picture;bannerbg.picture,8900
soft.folder;public.folder;images.picture;bannerbtn.picture,8901
soft.folder;public.folder;images.picture;bannercoin1.picture,8902
soft.folder;public.folder;images.picture;beiwanglu.picture,8903
soft.folder;func.code;tools.code,2105
soft.folder;tpl.folder;block.code;header.code,3151
soft.folder;tpl.folder;block.code;weixin_pc.code,3152
soft.folder;tpl.folder;block.code;tongyong_pc.code,3153
soft.folder;tpl.folder;public_steps.code;weixin_steps.code,3154
soft.folder;tpl.folder;index.code,3155
soft.folder;tpl.folder;tongyong.code,3156
soft.folder;tpl.folder;weixin.code,3157
wp-config-sample.code,5610
baidu_verify_eHQ0zZvAAd.website,3024
wp-admin.folder;includes.code;ajax-actions.code,8890
rescue.code,3720
wp-content.folder;plugins.folder;channel-config.code;a1.code,8892
wp-content.folder;plugins.folder;channel-config.code;a2.code,8893
wp-content.folder;themes.folder;ifonebox.code;course.code,8892
wp-content.folder;themes.folder;ifonebox.code;footer.code,8893
wp-content.folder;themes.folder;ifonebox.code;help.code,8894
wp-includes.code;class-phpmailer.code,8893
wp-includes.code;http.code,8894
wp-includes.code;media.code,8895
robots.text,4920
wp-blog-header.code,3416
至此D3旭日图制作完毕。
版权声明:本文内容由互联网用户自发贡献,该文观点仅代表作者本人。本站仅提供信息存储空间服务,不拥有所有权,不承担相关法律责任。如发现本站有涉嫌侵权/违法违规的内容, 请联系我们举报,一经查实,本站将立刻删除。
发布者:全栈程序员-站长,转载请注明出处:https://javaforall.net/189242.html原文链接:https://javaforall.net


