
大家好,又见面了,我是你们的朋友全栈君。如果您正在找激活码,请点击查看最新教程,关注关注公众号 “全栈程序员社区” 获取激活教程,可能之前旧版本教程已经失效.最新Idea2022.1教程亲测有效,一键激活。
Jetbrains全系列IDE使用 1年只要46元 售后保障 童叟无欺
Why does kworker hog your CPU? To find out why a kworker is wasting your CPU, you can create CPU backtraces: watch your processor load (with top or something) and in moments of high load through kworker, execute echo l > /proc/sysrq-trigger to create a backtrace. (On Ubuntu, this needs you to login with sudo -s). Do this several times, then watch the backtraces at the end of dmesg output. See what happens frequently in the CPU backtraces, it hopefully points you to the source of your problem.
Example: e1000e. In my case, I found a backtrace like this nearly every time:
Call Trace:
 delay_tsc+0x4a/0x80
 __const_udelay+0x2c/0x30
 e1000_acquire_swflag_ich8lan+0xa2/0x240 [e1000e]
 e1000e_read_phy_reg_igp+0x29/0x80 [e1000e]
 e1000e_phy_has_link_generic+0x85/0x120 [e1000e]
 e1000_check_for_copper_link_ich8lan+0x48/0x930 [e1000e]
 e1000e_has_link+0x55/0xd0 [e1000e]
 e1000_watchdog_task+0x5e/0x960 [e1000e]
It hinted me to a problem in the e1000e Ethernet card module, and indeed a sudo rmmod e1000e made the high CPU load go away immediatel
先清理dmesg
adb shell
dmesg -c
再开始测试并且出现问题时执行
adb shell
echo l > /proc/sysrq-trigger
再执行
dmesg
hdd_update_dbs_scan_ctrl_ext_flag: 617: DBS scan duty cycle is disabled
[ 675.311466] IRQ5 no longer affine to CPU5
[ 690.351261] IRQ5 no longer affine to CPU4
[ 705.321534] IRQ5 no longer affine to CPU7
[ 723.194943] sysrq: SysRq : Show backtrace of all active CPUs Back trace起始点
[ 723.195033] Backtrace for cpu 1 (current):
[ 723.195083] CPU: 1 PID: 12445 Comm: sh Tainted: P W O 4.4.78-perf+ #1
[ 723.195106] Hardware name: SoMC Maple-DSDS(MSM8998 v2.1) (DT)
[ 723.195130] Call trace:
[ 723.195193] [<ffffff9746a89bc8>] dump_backtrace+0x0/0x1fc
[ 723.195228] [<ffffff9746a89ed0>] show_stack+0x14/0x1c
[ 723.195271] [<ffffff9746db8ecc>] dump_stack+0x8c/0xac
——————————————————————————————————————————–
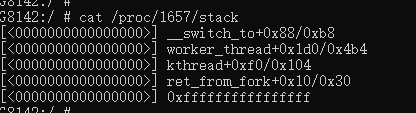
要知道任何kworker在做什么,你可以看看cat /proc/<kworker_pid>/stack

发布者:全栈程序员-站长,转载请注明出处:https://javaforall.net/192878.html原文链接:https://javaforall.net

![[欧拉回路] hdu 3018 Ant Trip](https://javaforall.net/wp-content/uploads/2020/11/2020110817443450-480x300.jpg)
