
html
页面引用js

css和html
*{padding:0;margin:0;border: 0;}
js
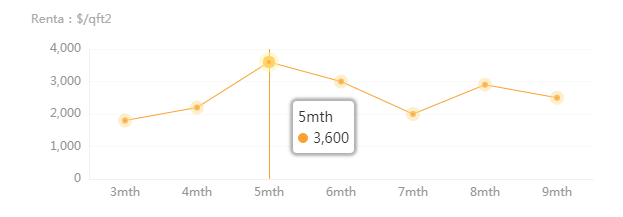
var dom = document.getElementById("container"); var myChart = echarts.init(dom); var app = {}; option = null; option = { title : { // text: 'Monthly Repayment (estimated)', subtext: 'Renta:$/qft2', x:'left', top:10 }, tooltip: { trigger: 'axis', axisPointer: { type: 'line', lineStyle:{ color:'#faa12f' }, z:1 }, backgroundColor:'rgb(255,255,255)', extraCssText:'box-shadow:0 0 3px 3px rgba(0, 0, 0, 0.3)', textStyle:{ color:'#333' }, }, //x轴 xAxis: { type: 'category', // boundaryGap: false, // splitLine:{show: false},//去除网格线 // splitArea : {show : false},//去除网格区域 data: ['3mth', '4mth', '5mth', '6mth', '7mth', '8mth', '9mth'], axisLine: {//x轴线设置 lineStyle: { type: 'solid', color: '#f0f0f0',//x线的颜色 width:'1'//坐标线的宽度 } }, axisLabel: {//x轴字体颜色 textStyle: { color: '#', } }, axisTick:{//去掉x轴刻度 show: false } }, yAxis: { type: 'value', // name: 'Renta:$/qft2', splitLine:{//保留网格线 show: true, lineStyle:{//y轴网格线设置 color: '#f9f9f9', width: 1, type: 'solid' } }, splitArea : {show :false},//去除网格区域 axisLine: {//y轴线设置 lineStyle: { type: 'solid', color:'#f0f0f0', width:'1' } }, axisLabel: {//y轴字体颜色 textStyle: { color: '#' } }, axisTick:{//去掉Y轴刻度 show: false } }, series: [{ data: [1800, 2200, 3600, 3000, 2000, 2900, 2500], type: 'line', symbol:"circle",//设定为实心点 类型 : 'circle', 'rect', 'roundRect', 'triangle', 'diamond', 'pin', 'arrow', 'none' symbolSize:6,//圆点大小 // showSymbol:true, hoverAnimation:true, animation: true, itemStyle: { normal: { color: "#faa12f",//圆点颜色 borderColor:'rgba(251,222,153,0.5)', borderWidth:8, lineStyle: {//折线颜色大小 type:'solid', //'dotted'虚线 'solid'实线 color: "#faa12f", width:1, borderColor:'#faa12f', //拐点边框颜色 } } }, // textStyle:{//x、y轴字体颜色大小 // fontSize:12, // color:'#' // }, }], }; if (option && typeof option === "object") { myChart.setOption(option, true); }预览效果

版权声明:本文内容由互联网用户自发贡献,该文观点仅代表作者本人。本站仅提供信息存储空间服务,不拥有所有权,不承担相关法律责任。如发现本站有涉嫌侵权/违法违规的内容, 请联系我们举报,一经查实,本站将立刻删除。
发布者:全栈程序员-站长,转载请注明出处:https://javaforall.net/211502.html原文链接:https://javaforall.net


