
DPC_WATCHDOG_VIOLATION蓝屏分析
1. 背景
今天在我们客户的电脑上面出现了一个蓝屏,并且反馈蓝屏码很奇怪是DPC_WATCHDOG_VIOLATION;本来PC上面没有安装我们的任何软件,这个问题与我们无关。但是出于对技术的好奇,本人分析了一下这个问题,并且这个问题本人以前也没有遇到过,因此写文记录一下这个分析过程。
1. 分析
1.1 初步分析
拿到dmp文件之后,我们先查看错误码信息:
DPC_WATCHDOG_VIOLATION (133) The DPC watchdog detected a prolonged run time at an IRQL of DISPATCH_LEVEL or above. Arguments: Arg1: 0000000000000000, A single DPC or ISR exceeded its time allotment. The offending component can usually be identified with a stack trace. Arg2: 0000000000000501, The DPC time count (in ticks). Arg3: 0000000000000500, The DPC time allotment (in ticks). Arg4: fffff8077ff73358, cast to nt!DPC_WATCHDOG_GLOBAL_TRIAGE_BLOCK, which contains additional information regarding this single DPC timeout 从描述上面来看大概是这个意思:DPC看门狗检测到了在DPC或者DPC级别上面执行的太久了,导致蓝屏。这个就很奇怪了,难道Windows无法在DPC上面执行太久吗?还真是的,我们看一下这个的基本分析。
1.2 DPC WATCHDOG
char __fastcall KeInitSystem(int a1) {
//... if (!HviIsAnyHypervisorPresent()) KeEnableWatchdogTimeout = 1; //... } HviIsAnyHypervisorPresent这个函数返回cpuid指令是否由hypervisor实现,如果不是的话,那么开启WatchDog。
并且我们在ntoskrnl中可以看到如下定义:
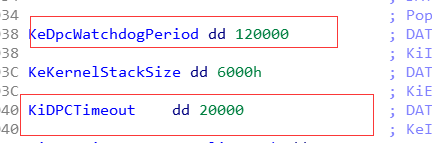

这个两个分别代表DPC狗超时的最大时间和单个DPC最大的时间。
1.3 DPC超时时间获取
通过KeQueryDpcWatchdogInformation可以获取到当前处理器的DPC超时时间信息,如下:
NTSTATUS KeQueryDpcWatchdogInformation( PKDPC_WATCHDOG_INFORMATION WatchdogInformation ); typedef struct _KDPC_WATCHDOG_INFORMATION {
    ULONG DpcTimeLimit; ULONG DpcTimeCount; ULONG DpcWatchdogLimit; ULONG DpcWatchdogCount; ULONG Reserved; } KDPC_WATCHDOG_INFORMATION, *PKDPC_WATCHDOG_INFORMATION;
其中:
DpcTimeLimit: 当前处理器单个延迟过程调用的时间限制。如果已禁用DPC超时,则此值设置为0。DpcTimeCount: 如果已启用DPC超时,则本次延迟过程调用的剩余时间。DpcWatchdogLimit: 一系列延迟过程调用所允许的总时间限制。如果已禁用DPC看门狗,则此值设置为零。DpcWatchdogCount: 如果启用DPC看门狗,则当前连续延迟过程调用序列的剩余时间值。
1.4 分析
有了上面这些基础知识以后我们就可以分析这个问题了:
2: kd> k # Child-SP RetAddr Call Site 00 ffff8380`20bf5b08 fffff807`7fbee83d nt!KeBugCheckEx 01 ffff8380`20bf5b10 fffff807`7fa1f857 nt!KeAccumulateTicks+0x1cbe1d 02 ffff8380`20bf5b70 fffff807`804b91e1 nt!KeClockInterruptNotify+0xc07 03 ffff8380`20bf5f30 fffff807`7fa029e5 hal!HalRequestSoftwareInterrupt+0x171 04 ffff8380`20bf5f60 fffff807`7fbc2cba nt!KiCallInterruptServiceRoutine+0xa5 05 ffff8380`20bf5fb0 fffff807`7fbc3227 nt!KiInterruptSubDispatchNoLockNoEtw+0xfa 06 ffffbb07`daa476f0 fffff807`7faa26e8 nt!KiInterruptDispatchNoLockNoEtw+0x37 07 ffffbb07`daa47880 fffff807`7fa27dfb nt!KxWaitForSpinLockAndAcquire+0x28 08 ffffbb07`daa478b0 fffff807`859ef1c2 nt!KeAcquireSpinLockAtDpcLevel+0x5b 09 ffffbb07`daa478e0 fffff807`859ed8b0 tcpip!IsSessionStateFastPathCompatible+0x12 0a ffffbb07`daa47a00 fffff807`7fa6ae85 tcpip!WfpIndicateSendControl+0x2d0 0b ffffbb07`daa47c40 fffff807`7fa6a4df nt!KiExecuteAllDpcs+0x305 0c ffffbb07`daa47d80 fffff807`7fbc8265 nt!KiRetireDpcList+0x1ef 0d ffffbb07`daa47fb0 fffff807`7fbc8050 nt!KxRetireDpcList+0x5 0e ffffbb07`db1129d0 fffff807`7fbc7720 nt!KiDispatchInterruptContinue 0f ffffbb07`db112a00 00007ffa`9dc674e9 nt!KiDpcInterrupt+0x2f0 从这个堆栈我们发现2号CPU目前在执行DPC例程,然后时钟中断产生,通过调用KeAccumulateTicks计算DPC的总执行时间,发现执行超时蓝屏。 那么我们看一下当前CPU的DCP超时信息:
2: kd> dt nt!_KPRCB ffffe40180 DPC* +0x2e00 DpcData : [2] _KDPC_DATA +0x2e50 DpcStack : 0xffffbb07`daa47fb0 Void +0x2e5c DpcRequestRate : 0 +0x2e64 DpcLastCount : 0x3c0c +0x2e6a DpcRoutineActive : 0x1 '' +0x2e6c DpcRequestSummary : 0n19 +0x2e6c DpcRequestSlot : [2] 0n19 +0x2e6c DpcNormalProcessingActive : 0y1 +0x2e6c DpcNormalProcessingRequested : 0y1 +0x2e6c DpcNormalThreadSignal : 0y0 +0x2e6c DpcNormalTimerExpiration : 0y0 +0x2e6c DpcNormalDpcPresent : 0y1 +0x2e6c DpcNormalLocalInterrupt : 0y0 +0x2e6c DpcNormalSpare : 0y0000000000 (0) +0x2e6c DpcThreadActive : 0y0 +0x2e6c DpcThreadRequested : 0y0 +0x2e6c DpcThreadSpare : 0y00000000000000 (0) +0x5880 DpcGate : _KGATE +0x58e8 DpcWatchdogPeriod : 0n7680 +0x58ec DpcWatchdogCount : 0n1280 +0x58f4 DpcWatchdogProfileCumulativeDpcThreshold : 0x1b80 +0x5b8c DpcTime : 0x515 +0x5b9c DpcTimeCount : 0x501 +0x5ba0 DpcTimeLimit : 0x500 +0x5c00 DpcWatchdogProfileSingleDpcThreshold : 0x496 +0x5f58 DpcWatchdogDpc : _KDPC +0x5f98 DpcWatchdogTimer : _KTIMER +0x61a8 DpcWatchdogProfile : 0xffffaa0f` -> 0x00000000`0000000e Void +0x61b0 DpcWatchdogProfileCurrentEmptyCapture : 0xffffaa0f` -> (null) 这里可以看到DpcTimeLimit : 0x500 总时间tick 数目为500,但是已经执行了DpcTimeCount : 0x501 501个,导致蓝屏。
从上面的堆栈我们可以发现这个DPC是TCPIP发起的DPC,由Windows自身引起的问题应该比较小,不过很大可能是因为nt!KeAcquireSpinLockAtDpcLevel占用自旋锁时间太长,导致超时,那么我们看下其他的处理器在干嘛,我们看到一个很可疑的驱动:
# Child-SP RetAddr Call Site 00 ffffbb07`ddb96140 fffff807`7dcf3467 Wdf01000!imp_WdfIoQueueRetrieveNextRequest+0x66 01 ffffbb07`ddb96180 fffff807`7dcf3100 xxxx+0x3467 02 ffffbb07`ddb961e0 fffff807`7dcf2cbb xxxx+0x3100 03 ffffbb07`ddb96210 fffff807`7dcf2393 xxxx+0x2cbb 04 ffffbb07`ddb96280 fffff807`8545bed0 xxxx+0x2393 05 ffffbb07`ddb962b0 fffff807`8545b879 NETIO!KfdClassify+0x28e0 06 ffffbb07`ddb96380 fffff807`8545aed9 NETIO!KfdClassify+0x2289 07 ffffbb07`ddb964c0 fffff807`8545d1da NETIO!KfdClassify+0x18e9 08 ffffbb07`ddb96640 fffff807`85459b91 NETIO!KfdClassify+0x3bea 09 ffffbb07`ddb967d0 fffff807`a NETIO!KfdClassify+0x5a1 0a ffffbb07`ddb96be0 fffff807`85458f63 NETIO!WfpStreamInspectReceive+0x8fa 0b ffffbb07`ddb96d70 fffff807`a4 NETIO!WfpStreamInspectReceive+0x523 0c ffffbb07`ddb97150 fffff807`859e85e0 NETIO!WfpStreamInspectSend+0x274 0d ffffbb07`ddb971d0 fffff807`859e8144 tcpip+0x285e0 0e ffffbb07`ddb972e0 fffff807`7fa69e18 tcpip+0x28144 0f ffffbb07`ddb97310 fffff807`7fa69d8d nt!KeExpandKernelStackAndCalloutInternal+0x78 10 ffffbb07`ddb97380 fffff807`85a271d4 nt!KeExpandKernelStackAndCalloutEx+0x1d 11 ffffbb07`ddb973c0 fffff807`88ce9348 tcpip+0x671d4 12 ffffbb07`ddb97430 fffff807`88ce32ed afd!AfdTLStartBufferedVcSend+0xa0 13 ffffbb07`ddb974e0 fffff807`88ce0120 afd!AfdSend+0x9cd 14 ffffbb07`ddb97740 fffff807`7fa31f39 afd!AfdDispatch+0x160 15 ffffbb07`ddb977b0 fffff807`7ffe93f5 nt!IofCallDriver+0x59 因此我们大概猜测,因为这个线程执行导致了另外线程DPC一直执行,我们看下IRQL级别
3: kd> !irql Debugger saved IRQL for processor 0x3 -- 0 (LOW_LEVEL) 这里比较奇怪了,如果是这个线程占用了自旋锁的话,那么将会这个时候IRQL应该是2才对,但是这个是0,说明刚开始的猜测是错误的,那么我们简单看一下这个线程DPC的执行过程:
3: kd> dt nt!_KPRCB ffffed5180 DPC* +0x2e00 DpcData : [2] _KDPC_DATA +0x2e50 DpcStack : 0xffffbb07`daa57fb0 Void +0x2e5c DpcRequestRate : 0 +0x2e64 DpcLastCount : 0x22c9 +0x2e6a DpcRoutineActive : 0 '' +0x2e6c DpcRequestSummary : 0n50 +0x2e6c DpcRequestSlot : [2] 0n50 +0x2e6c DpcNormalProcessingActive : 0y0 +0x2e6c DpcNormalProcessingRequested : 0y1 +0x2e6c DpcNormalThreadSignal : 0y0 +0x2e6c DpcNormalTimerExpiration : 0y0 +0x2e6c DpcNormalDpcPresent : 0y1 +0x2e6c DpcNormalLocalInterrupt : 0y1 +0x2e6c DpcNormalSpare : 0y0000000000 (0) +0x2e6c DpcThreadActive : 0y0 +0x2e6c DpcThreadRequested : 0y0 +0x2e6c DpcThreadSpare : 0y00000000000000 (0) +0x5880 DpcGate : _KGATE +0x58e8 DpcWatchdogPeriod : 0n7680 +0x58ec DpcWatchdogCount : 0n1283 +0x58f4 DpcWatchdogProfileCumulativeDpcThreshold : 0x1b80 +0x5b8c DpcTime : 3 +0x5b9c DpcTimeCount : 0 +0x5ba0 DpcTimeLimit : 0x500 +0x5c00 DpcWatchdogProfileSingleDpcThreshold : 0x496 +0x5f58 DpcWatchdogDpc : _KDPC +0x5f98 DpcWatchdogTimer : _KTIMER +0x61a8 DpcWatchdogProfile : 0xffffaa0f` -> (null) +0x61b0 DpcWatchdogProfileCurrentEmptyCapture : 0xffffaa0f` -> (null) 这里看到DpcWatchdogCount : 0n1283这个值很大,那么可以推测这个CPU执行的DPC将非常多,导致的概率也非常大,那么我们干掉这个驱动。
测试,果然蓝屏问题消失。
2. 总结
其实还有一个命令可以直接查看watchdog的信息,就是!swd,如下:
3: kd> !swd SWD: Initial DPC Watchdog Period: 120.000 (s) SWD: Initial DPC Timeout Period: 20.000 (s) CPU Type Counter Time (s) 0: DPC Period 120.000 (s) 0: DPC Count 0.000 (s) 0: DPCTimeout Period 20.000 (s) 0: DPCTimeout Count 20.000 (s) 0: Thread <Disabled> 1: DPC Period 120.000 (s) 1: DPC Count 0.000 (s) 1: DPCTimeout Period 20.000 (s) 1: DPCTimeout Count 20.000 (s) 1: Thread <Disabled> 2: DPC Period 120.000 (s) 2: DPC Count 20.000 (s) 2: DPCTimeout Period 20.000 (s) 2: DPCTimeout Count 70.939 (s) 2: Thread <Disabled> 3: DPC Period 120.000 (s) 3: DPC Count 20.046 (s) 3: DPCTimeout Period 20.000 (s) 3: DPCTimeout Count 20.000 (s) 3: Thread <Disabled> 从上面的分析我们可以发现,Windows应该是趋向于在DPC级别少做事情,因为DPC会影响整体系统的响应(无法线程调度了);因此如果在DPC中需要做太多事情的话,MSDN推荐使用Worker去处理。
并且我们平时在使用自旋锁等提升IRQL到DPC级别的操作的时候,也需要尽量避免过于复杂的操作。
发布者:全栈程序员-站长,转载请注明出处:https://javaforall.net/225980.html原文链接:https://javaforall.net


