
通过本文,记录分享我利用Python对已存在的excel表格进行数据处理。
因为是没学可视化之前做的,所以都展示在后台上。
1. 功能分析
1.1加载文件夹内所有的Excel数据;
1.2 生产贡献度分析图表(以柱状图显示表格数据);
1.3提起Excel表格中指定列数据;
1.4定向筛选所需数据;
1.5多表数据统计排行;
1.6多表数据合并新excel文件。
2. 系统开发必备
2.1 系统开发环境
本系统的软件开发及运行环境具体如下:
- 操作系统:Windows7、Windows10;
- Python版本:Python3.9
- 开发工具:Pycharm
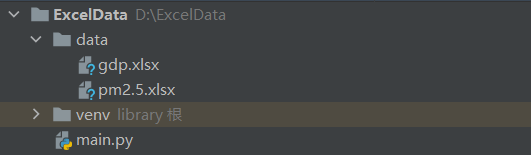
2.2 文件夹组织结构

3.导库

import os import xlrd2 #xlrd: 对Excel进行读相关操作 import xlwt #xlwt: 对Excel进行写相关操作,且只能创建一个全新的Excel然后进行写入和保存。 import numpy import matplotlib from prettytable import PrettyTable #PrettyTable 是python中的一个第三方库,可用来生成美观的ASCII格式的表格 from matplotlib import pyplot as plt 4. 主函数设计
Excel数据分析师的主函数main(),主要用于实现系统的主界面。在主函数main()中,首先调用get_files_name()函数获取文件名。
get_files_name()函数代码如下:
#导入文件 def get_files_name(): """ 用于获取文件名 :return: 返回值为文件名组成的列表 """ file_list = os.listdir('./data') return file_list 然后调用load_data()函数来读取excel文件并字典方式保存。
#保存生产excel表 def load_data(file_list): """ 用于读取指定的文件并保存至字典数据结构中 :param file_list: 需要加载的文件列表 :return: 保存了文件内容的字典 """ dictory = {} for file in file_list: # 获取表格文件 book = xlrd2.open_workbook('./data/'+file) # 获取表格中的所有sheet names = book.sheet_names() # 获取第一个sheet sheet = book.sheet_by_index(0) # 获取当前表格的行数 rows = sheet.nrows # 获取当前表格的列数 cols = sheet.ncols # 获取表头文件,即表格第一行 head = sheet.row_values(0) for row in range(rows-1): # 如果当前字典中没有该城市则创建一个 if not sheet.cell_value(row+1, 0) in dictory.keys(): dictory[sheet.cell_value(row+1, 0)] = {} for col in range(cols-1): dictory[sheet.cell_value(row+1, 0)][head[col+1]] = float(sheet.cell_value(row+1, col+1)) return dictory接着调用menu()函数生成功能选择菜单。
menu()函数代码如下:
# 打印菜单 def menu(): print(" ----------Excel 数据分析师----------") print("{:<30}".format(" ==============功能菜单============== ")) print("{:<30}".format(" 1. 显示当前数据 ")) print("{:<30}".format(" 2. 以柱状图展示当前数据 ")) print("{:<30}".format(" 3. 提起指定列 ")) print("{:<30}".format(" 4. 定向筛选指定元素 ")) print("{:<30}".format(" 5. 数据排行 ")) print("{:<30}".format(" 6. 重新加载数据 ")) print("{:<30}".format(" 7. 保存当前数据 ")) print("{:<30}".format(" 0. 退出程序 ")) print("{:<30}".format(" ==================================== ")) print("{:<30}".format(" 说明:输入相应数字后按下回车选择指定功能 ")) print('\n') 并且应用if语句控制各个子函数的调用,从而实现对Excel文件的选择,Excel数据的加载,选择、筛选、合并、排序和统计等功能。
主函数完整代码如下:
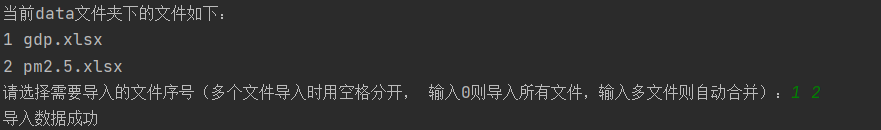
if __name__ == "__main__": # 导入文件 files = get_files_name() data = {} print("当前data文件夹下的文件如下:") num = 1 for file in files: print(num, file) num += 1 while(1): index_str = input("请选择需要导入的文件序号(多个文件导入时用空格分开, 输入0则导入所有文件,输入多文件则自动合并):") index_list = index_str.split(' ') try: index_list.remove('') except: pass choice_file_list = [] if index_list[0] == '0': choice_file_list = files break else: try: for item in index_list: choice_file_list.append(files[int(item)-1]) except: print("输入序号有误") continue if choice_file_list: break else: print("输入序号有误") data = load_data(choice_file_list) print("导入数据成功\n") # 调用函数,打印菜单 menu() while 1: choice = input("请选择指定功能:") if choice == '0': print("\n退出程序\n") exit() elif choice == '1': print("当前功能:显示当前数据") show_data(data) input('\n按下回车返回菜单') menu() elif choice == '2': print("当前功能:以柱状图显示数据") draw_plot(data) input('\n按下回车返回菜单') menu() elif choice == '3': print("当前功能:筛选指定列") keys = list(data[list(data.keys())[0]].keys()) print("当前表格中的列如下:") num = 1 for key in keys: print(num, key) num += 1 choice_col_list = [] while (1): index_str = input("请选择需要筛选出的列序号(多列之间用空格分开,0代表所有列):") index_list = index_str.split(' ') try: index_list.remove('') except: pass choice_file_list = [] if index_list[0] == '0': choice_col_list = keys break else: try: for item in index_list: choice_col_list.append(keys[int(item) - 1]) except: print("输入序号有误") continue if choice_col_list: break else: print("输入序号有误") data = get_specified_cols(data, choice_col_list) print("筛选成功") input('\n按下回车返回菜单') menu() elif choice == '4': print("当前功能:筛选指定行") keys = list(data[list(data.keys())[0]].keys()) print("当前表格中的列如下:") num = 1 print(num, "城市") num += 1 for key in keys: print(num, key) num += 1 col = int(input("请输入需要进行筛选的数据所在的列:"))-2 if col == -1: col = '城市' else: col = keys[col] op_list = ['<', '<=', '=', '>=', '>'] print("比较操作符如下:") num = 1 for op in op_list: print(num, op) num += 1 operation = int(input("请输入比较操作符前的序号:"))-1 operation = op_list[operation] value = input("请输入需要筛选的值:") data = get_specified_data(data, operation, col, value) print("筛选成功") input('\n按下回车返回菜单') menu() elif choice == '5': print("当前功能:数据排序") keys = list(data[list(data.keys())[0]].keys()) print("当前表格中的列如下:") num = 1 for key in keys: print(num, key) #显示当前表格中的所有的列 num += 1 col = int(input("请输入需要进行排序的数据所在的列:")) - 1 col = keys[col] reverse = input("排序方式:\n1 从大到小排序\n2 从小到大排序\n") if reverse == '1': data = sort_data(data, col, True) elif reverse == '2': data = sort_data(data, col, False) else: print("输入有误") input('\n按下回车返回菜单') menu() elif choice == '6': # 导入文件 files = get_files_name() data = {} print("当前文件夹下的文件如下:") num = 1 for file in files: print(num, file) num += 1 while (1): index_str = input("请选择需要导入的文件序号(多个文件导入时用空格分开, 输入0则导入所有文件,输入多文件则自动合并):") index_list = index_str.split(' ') try: index_list.remove('') except: pass choice_file_list = [] if index_list[0] == '0': choice_file_list = files break else: try: for item in index_list: choice_file_list.append(files[int(item) - 1]) except: print("输入序号有误") continue if choice_file_list: break else: print("输入序号有误") data = load_data(choice_file_list) print("导入数据成功\n") # 打印菜单 menu() elif choice == '7': print("当前功能:保存数据") save(data) input('\n按下回车返回菜单') menu() else: print("请输入正确的数字") input('\n按下回车返回菜单') menu()5.模块设计
5.1 加载文件夹内所有的Excel数据
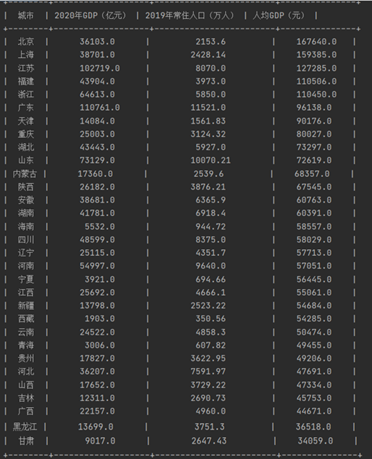
show_data()函数通过PrettyTable 库(PrettyTable 库是python中的一个第三方库,可用来生成美观的ASCII格式的表格)将之前保存的字典数据生成表格。
#加载显示数据 def show_data(dictory): try: keys = list(dictory[list(dictory.keys())[0]].keys()) except: print("当前数据为空") return head = ['城市'] head.extend(keys) table = PrettyTable(head) for key in dictory.keys(): line = [key] for key_2 in keys: line.append(dictory[key][key_2]) table.add_row(line) print(table)效果图如下:

5.2生产贡献度分析图表(以柱状图显示表格数据)
draw_plot( )函数使用了matplotlib库。通过atplotlib.rc( )来设置字体,通过plt.bar( )函数来绘制柱状图,通过plt.legend( )函数来给图添加图例。
#制作图表 def draw_plot(dictory): font = {'family': 'MicroSoft Yahei', 'weight': 'bold', 'size': 7} matplotlib.rc('font', font) #设置中文字体 # 定义三个颜色 index = numpy.arange(len(dictory.keys())) color = [(256 / 256, 0 / 256, 0 / 256, 1), (0 / 256, 0 / 256, 256 / 256, 1), (0 / 256, 256 / 256, 0 / 256, 1), (0 / 256, 0 / 256, 0 / 256, 1)] first_key = list(dictory.keys()) first_key = first_key[0] cols = list(dictory[first_key].keys()) data = [] for i in range(len(cols)): data.append([]) for key in dictory.keys(): for col in range(len(cols)): data[col].append(dictory[key][cols[col]]) offset = -1/4 for i in range(len(cols)): plt.bar(index+offset, data[i], color=color[i], width=1 / 5) #通过bar函数可以用柱状图来表达一些变量的统计分布 offset += 1/4 plt.xticks(index, dictory.keys())#表示刻度 plt.legend(cols)#给图像加上图例 plt.show()效果图如下:

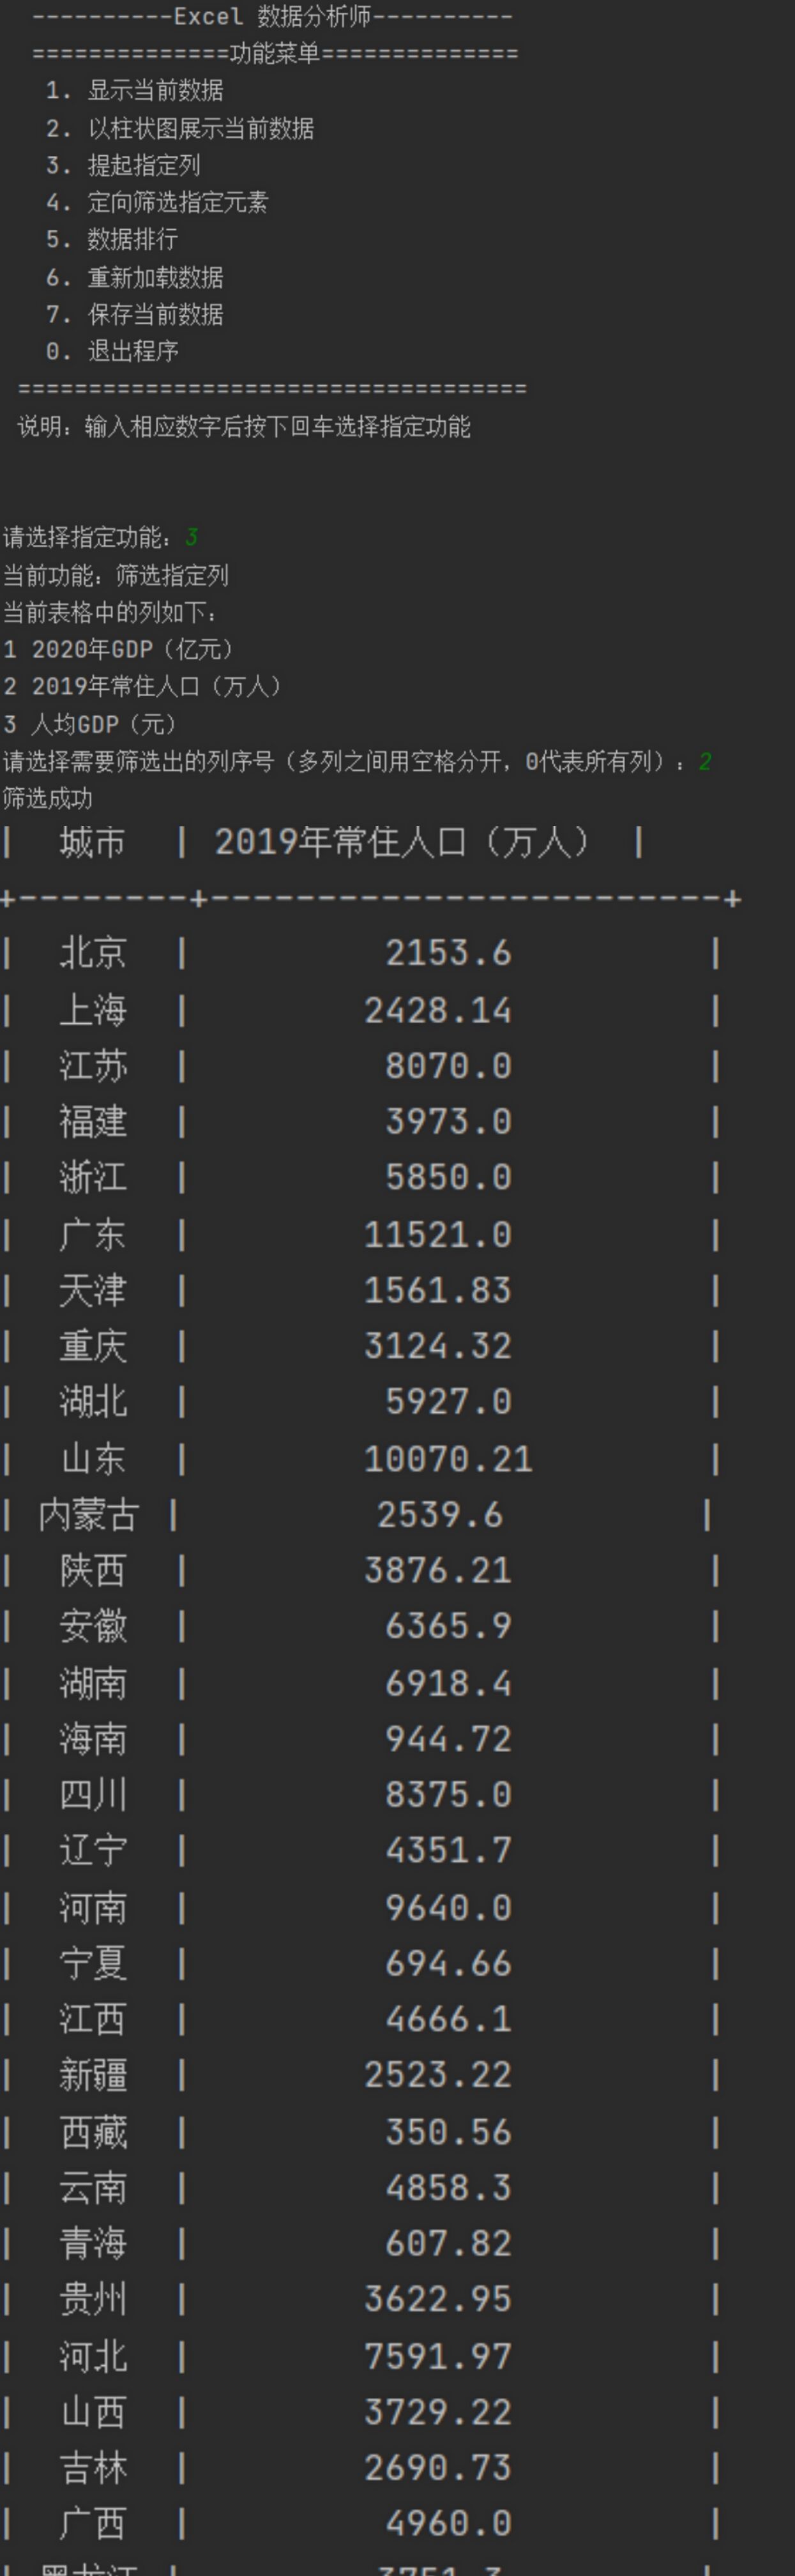
5.3提起Excel表格中指定列数据
get_specified_cols()函数根据用户在菜单输入的列名,通过字典的索引筛选出列名,加载指定列的所有数据。
#提起指定列 def get_specified_cols(dictory, col_name_list): """ 筛选出指定的列 :param dictory:原始字典 :param col_name_list: 需要筛选出的列名,城市名默认出现 :return: 筛选之后的字典 """ new_dict = {} for key in dictory.keys(): new_dict[key] = {} for col_name in col_name_list: new_dict[key][col_name] = dictory[key][col_name] return new_dict 效果图如下:
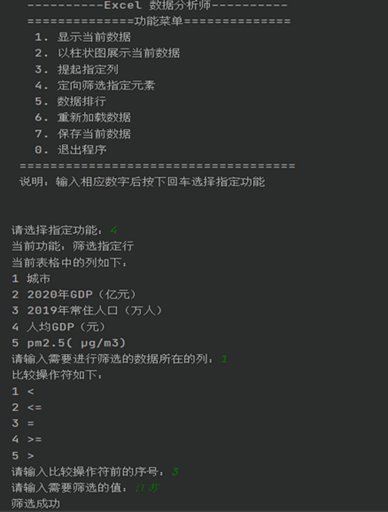
5.4定向筛选所需数据
get_specified_data()函数根据输入的操作符、列名以及指定的value进行筛选,比如筛选出人均GDP大于5000的,则operation = ‘>’ ;col_name = ‘人均GDP’ ; value = 500。
def get_specified_data(dictory, operation, col_name, value): """ 根据输入的操作符、列名以及指定的value进行筛选,比如筛选出人均GDP大于5000的,则operation = '>', col_name = '人均GDP', value = 5000 :param dictory: 原始数据 :param operation: 操作符 :param col_name: 需要比较的列 :param value: 需要比较的值 :return: 筛选之后的字典 """ new_dict = {} if col_name != "城市": for key in dictory.keys(): # flag用于标记是否需要添加该行 value = float(value) flag = 0 if operation == '>': if dictory[key][col_name] > value: flag = 1 elif operation == '>=': if dictory[key][col_name] >= value: flag = 1 elif operation == '=': if dictory[key][col_name] == value: flag = 1 elif operation == '<=': if dictory[key][col_name] <= value: flag = 1 elif operation == '<': if dictory[key][col_name] < value: flag = 1 else: flag = 0 if flag == 1: new_dict[key] = {} new_dict[key] = dictory[key] else: for key in dictory.keys(): # flag用于标记是否需要添加该行 flag = 0 if operation == '>': if key > value: flag = 1 elif operation == '>=': if key >= value: flag = 1 elif operation == '=': if key == value: flag = 1 elif operation == '<=': if key <= value: flag = 1 elif operation == '<': if key < value: flag = 1 else: flag = 0 if flag == 1: new_dict[key] = {} new_dict[key] = dictory[key] return new_dict效果图如下:
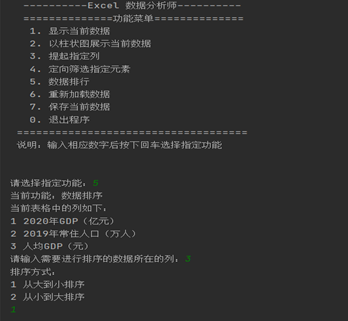
5.5多表数据统计排行
sort_data()函数根据key和reverse对数据进行排序。dictory: 传入的字典对象。
key: 需要排序的关键字,即哪一列。reverse: 是否从大到小排序,false即为从小到大排序,最后return 返回数据。
#数据排行 def sort_data(dictory, key, reverse): """ 根据key和reverse对数据进行排序 :param dictory: 传入的字典对象 :param key: 需要排序的关键字,即那一列 :param reverse: 是否从大到小排序,false即为从小到大排序 :return: """ data = dictory if not reverse: data = dict(sorted(data.items(), key=lambda d: d[1][key], reverse=False)) #字典的升序 else: data = dict(sorted(data.items(), key=lambda d: d[1][key], reverse=True)) #字典的降序 return data 效果图如下:
5.6多表数据合并生成新excel文件
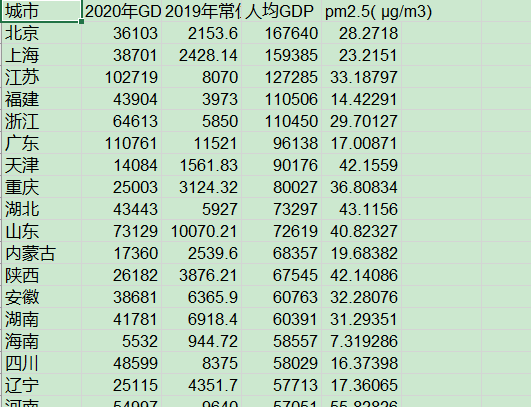
该功能在主函数中实现并调用save()函数保存合并后的数据并生成新的excel文件。
while(1): index_str = input("请选择需要导入的文件序号(多个文件导入时用空格分开, 输入0则导入所有文件,输入多文件则自动合并):") index_list = index_str.split(' ') try: index_list.remove('') except: pass choice_file_list = [] if index_list[0] == '0': choice_file_list = files break else: try: for item in index_list: choice_file_list.append(files[int(item)-1]) except: print("输入序号有误") continue if choice_file_list: break else: print("输入序号有误") data = load_data(choice_file_list) print("导入数据成功\n") def save(dictory): name = input("请输入文件名(无需加后缀):") book = xlwt.Workbook() sheet = book.add_sheet('Sheet1', cell_overwrite_ok=True) keys = list(data[list(data.keys())[0]].keys()) head = ["城市"] head.extend(keys) for h in range(len(head)): sheet.write(0, h, head[h]) cities = list(dictory.keys()) for city in range(len(cities)): sheet.write(city+1, 0, cities[city]) for key in range(len(keys)): sheet.write(city+1, key+1, dictory[cities[city]][keys[key]]) book.save('./data/'+name+'.xls') print("保存成功")效果图如下:


6.总结
这个程序是我将课本上的纯理论应用到实践中,进一步加深了我对知识的理解。最后将完整代码奉上:
import os import xlrd2 #xlrd: 对Excel进行读相关操作 import xlwt #xlwt: 对Excel进行写相关操作,且只能创建一个全新的Excel然后进行写入和保存。 import numpy import matplotlib from prettytable import PrettyTable #PrettyTable 是python中的一个第三方库,可用来生成美观的ASCII格式的表格 from matplotlib import pyplot as plt def get_files_name(): """ 用于获取文件名 :return: 返回值为文件名组成的列表 """ file_list = os.listdir('./data') return file_list #保存生产excel表 def load_data(file_list): """ 用于读取指定的文件并保存至字典数据结构中 :param file_list: 需要加载的文件列表 :return: 保存了文件内容的字典 """ dictory = {} for file in file_list: # 获取表格文件 book = xlrd2.open_workbook('./data/'+file) # 获取表格中的所有sheet names = book.sheet_names() # 获取第一个sheet sheet = book.sheet_by_index(0) # 获取当前表格的行数 rows = sheet.nrows # 获取当前表格的列数 cols = sheet.ncols # 获取表头文件,即表格第一行 head = sheet.row_values(0) for row in range(rows-1): # 如果当前字典中没有该城市则创建一个 if not sheet.cell_value(row+1, 0) in dictory.keys(): dictory[sheet.cell_value(row+1, 0)] = {} for col in range(cols-1): dictory[sheet.cell_value(row+1, 0)][head[col+1]] = float(sheet.cell_value(row+1, col+1)) return dictory #数据排行 def sort_data(dictory, key, reverse): """ 根据key和reverse对数据进行排序 :param dictory: 传入的字典对象 :param key: 需要排序的关键字,即那一列 :param reverse: 是否从大到小排序,false即为从小到大排序 :return: """ data = dictory if not reverse: data = dict(sorted(data.items(), key=lambda d: d[1][key], reverse=False)) #字典的升序 else: data = dict(sorted(data.items(), key=lambda d: d[1][key], reverse=True)) #字典的降序 return data def get_specified_cols(dictory, col_name_list): """ 筛选出指定的列 :param dictory:原始字典 :param col_name_list: 需要筛选出的列名,城市名默认出现 :return: 筛选之后的字典 """ new_dict = {} for key in dictory.keys(): new_dict[key] = {} for col_name in col_name_list: new_dict[key][col_name] = dictory[key][col_name] return new_dict def get_specified_data(dictory, operation, col_name, value): """ 根据输入的操作符、列名以及指定的value进行筛选,比如筛选出人均GDP大于5000的,则operation = '>', col_name = '人均GDP', value = 5000 :param dictory: 原始数据 :param operation: 操作符 :param col_name: 需要比较的列 :param value: 需要比较的值 :return: 筛选之后的字典 """ new_dict = {} if col_name != "城市": for key in dictory.keys(): # flag用于标记是否需要添加该行 value = float(value) flag = 0 if operation == '>': if dictory[key][col_name] > value: flag = 1 elif operation == '>=': if dictory[key][col_name] >= value: flag = 1 elif operation == '=': if dictory[key][col_name] == value: flag = 1 elif operation == '<=': if dictory[key][col_name] <= value: flag = 1 elif operation == '<': if dictory[key][col_name] < value: flag = 1 else: flag = 0 if flag == 1: new_dict[key] = {} new_dict[key] = dictory[key] else: for key in dictory.keys(): # flag用于标记是否需要添加该行 flag = 0 if operation == '>': if key > value: flag = 1 elif operation == '>=': if key >= value: flag = 1 elif operation == '=': if key == value: flag = 1 elif operation == '<=': if key <= value: flag = 1 elif operation == '<': if key < value: flag = 1 else: flag = 0 if flag == 1: new_dict[key] = {} new_dict[key] = dictory[key] return new_dict #制作图表 def draw_plot(dictory): font = {'family': 'MicroSoft Yahei', 'weight': 'bold', 'size': 7} matplotlib.rc('font', font) #设置中文字体 # 定义三个颜色 index = numpy.arange(len(dictory.keys())) color = [(256 / 256, 0 / 256, 0 / 256, 1), (0 / 256, 0 / 256, 256 / 256, 1), (0 / 256, 256 / 256, 0 / 256, 1), (0 / 256, 0 / 256, 0 / 256, 1)] first_key = list(dictory.keys()) first_key = first_key[0] cols = list(dictory[first_key].keys()) data = [] for i in range(len(cols)): data.append([]) for key in dictory.keys(): for col in range(len(cols)): data[col].append(dictory[key][cols[col]]) offset = -1/4 for i in range(len(cols)): plt.bar(index+offset, data[i], color=color[i], width=1 / 5) #通过bar函数可以用柱状图来表达一些变量的统计分布 offset += 1/4 plt.xticks(index, dictory.keys())#表示刻度 plt.legend(cols)#给图像加上图例 plt.show() def show_data(dictory): try: keys = list(dictory[list(dictory.keys())[0]].keys()) except: print("当前数据为空") return head = ['城市'] head.extend(keys) table = PrettyTable(head) for key in dictory.keys(): line = [key] for key_2 in keys: line.append(dictory[key][key_2]) table.add_row(line) print(table) def save(dictory): name = input("请输入文件名(无需加后缀):") book = xlwt.Workbook() sheet = book.add_sheet('Sheet1', cell_overwrite_ok=True) keys = list(data[list(data.keys())[0]].keys()) head = ["城市"] head.extend(keys) for h in range(len(head)): sheet.write(0, h, head[h]) cities = list(dictory.keys()) for city in range(len(cities)): sheet.write(city+1, 0, cities[city]) for key in range(len(keys)): sheet.write(city+1, key+1, dictory[cities[city]][keys[key]]) book.save('./data/'+name+'.xls') print("保存成功") # 打印菜单 def menu(): print(" ----------Excel 数据分析师----------") print("{:<30}".format(" ==============功能菜单============== ")) print("{:<30}".format(" 1. 显示当前数据 ")) print("{:<30}".format(" 2. 以柱状图展示当前数据 ")) print("{:<30}".format(" 3. 提起指定列 ")) print("{:<30}".format(" 4. 定向筛选指定元素 ")) print("{:<30}".format(" 5. 数据排行 ")) print("{:<30}".format(" 6. 重新加载数据 ")) print("{:<30}".format(" 7. 保存当前数据 ")) print("{:<30}".format(" 0. 退出程序 ")) print("{:<30}".format(" ==================================== ")) print("{:<30}".format(" 说明:输入相应数字后按下回车选择指定功能 ")) print('\n') if __name__ == "__main__": # 导入文件 files = get_files_name() data = {} print("当前data文件夹下的文件如下:") num = 1 for file in files: print(num, file) num += 1 while(1): index_str = input("请选择需要导入的文件序号(多个文件导入时用空格分开, 输入0则导入所有文件,输入多文件则自动合并):") index_list = index_str.split(' ') try: index_list.remove('') except: pass choice_file_list = [] if index_list[0] == '0': choice_file_list = files break else: try: for item in index_list: choice_file_list.append(files[int(item)-1]) except: print("输入序号有误") continue if choice_file_list: break else: print("输入序号有误") data = load_data(choice_file_list) print("导入数据成功\n") # 调用函数,打印菜单 menu() while 1: choice = input("请选择指定功能:") if choice == '0': print("\n退出程序\n") exit() elif choice == '1': print("当前功能:显示当前数据") show_data(data) input('\n按下回车返回菜单') menu() elif choice == '2': print("当前功能:以柱状图显示数据") draw_plot(data) input('\n按下回车返回菜单') menu() elif choice == '3': print("当前功能:筛选指定列") keys = list(data[list(data.keys())[0]].keys()) print("当前表格中的列如下:") num = 1 for key in keys: print(num, key) num += 1 choice_col_list = [] while (1): index_str = input("请选择需要筛选出的列序号(多列之间用空格分开,0代表所有列):") index_list = index_str.split(' ') try: index_list.remove('') except: pass choice_file_list = [] if index_list[0] == '0': choice_col_list = keys break else: try: for item in index_list: choice_col_list.append(keys[int(item) - 1]) except: print("输入序号有误") continue if choice_col_list: break else: print("输入序号有误") data = get_specified_cols(data, choice_col_list) print("筛选成功") input('\n按下回车返回菜单') menu() elif choice == '4': print("当前功能:筛选指定行") keys = list(data[list(data.keys())[0]].keys()) print("当前表格中的列如下:") num = 1 print(num, "城市") num += 1 for key in keys: print(num, key) num += 1 col = int(input("请输入需要进行筛选的数据所在的列:"))-2 if col == -1: col = '城市' else: col = keys[col] op_list = ['<', '<=', '=', '>=', '>'] print("比较操作符如下:") num = 1 for op in op_list: print(num, op) num += 1 operation = int(input("请输入比较操作符前的序号:"))-1 operation = op_list[operation] value = input("请输入需要筛选的值:") data = get_specified_data(data, operation, col, value) print("筛选成功") input('\n按下回车返回菜单') menu() elif choice == '5': print("当前功能:数据排序") keys = list(data[list(data.keys())[0]].keys()) print("当前表格中的列如下:") num = 1 for key in keys: print(num, key) #显示当前表格中的所有的列 num += 1 col = int(input("请输入需要进行排序的数据所在的列:")) - 1 col = keys[col] reverse = input("排序方式:\n1 从大到小排序\n2 从小到大排序\n") if reverse == '1': data = sort_data(data, col, True) elif reverse == '2': data = sort_data(data, col, False) else: print("输入有误") input('\n按下回车返回菜单') menu() elif choice == '6': # 导入文件 files = get_files_name() data = {} print("当前文件夹下的文件如下:") num = 1 for file in files: print(num, file) num += 1 while (1): index_str = input("请选择需要导入的文件序号(多个文件导入时用空格分开, 输入0则导入所有文件,输入多文件则自动合并):") index_list = index_str.split(' ') try: index_list.remove('') except: pass choice_file_list = [] if index_list[0] == '0': choice_file_list = files break else: try: for item in index_list: choice_file_list.append(files[int(item) - 1]) except: print("输入序号有误") continue if choice_file_list: break else: print("输入序号有误") data = load_data(choice_file_list) print("导入数据成功\n") # 打印菜单 menu() elif choice == '7': print("当前功能:保存数据") save(data) input('\n按下回车返回菜单') menu() else: print("请输入正确的数字") input('\n按下回车返回菜单') menu()发布者:全栈程序员-站长,转载请注明出处:https://javaforall.net/232466.html原文链接:https://javaforall.net


